Dogecoin (DOGE) Trades around $0.18 – Could it Drop to $0.13?

Jakarta, Pintu News – Dogecoin and the meme coin market as a whole have seen a 31% drop in value in the past month, according to data from CoinMarketCap. Although Elon Musk’s post on the X platform sparked attention on social media, the DOGE price did not show a comparable response.
The decline in Open Interest (OI) in the last few hours coincided with the retest of the resistance zone at $0.18. Is this a signal for traders to take short positions? The AMBCrypto page analyzes the price chart to project the next movement of DOGE while identifying the invalidation point of the scenario.
Dogecoin Price Rises 0.33% in 24 Hours
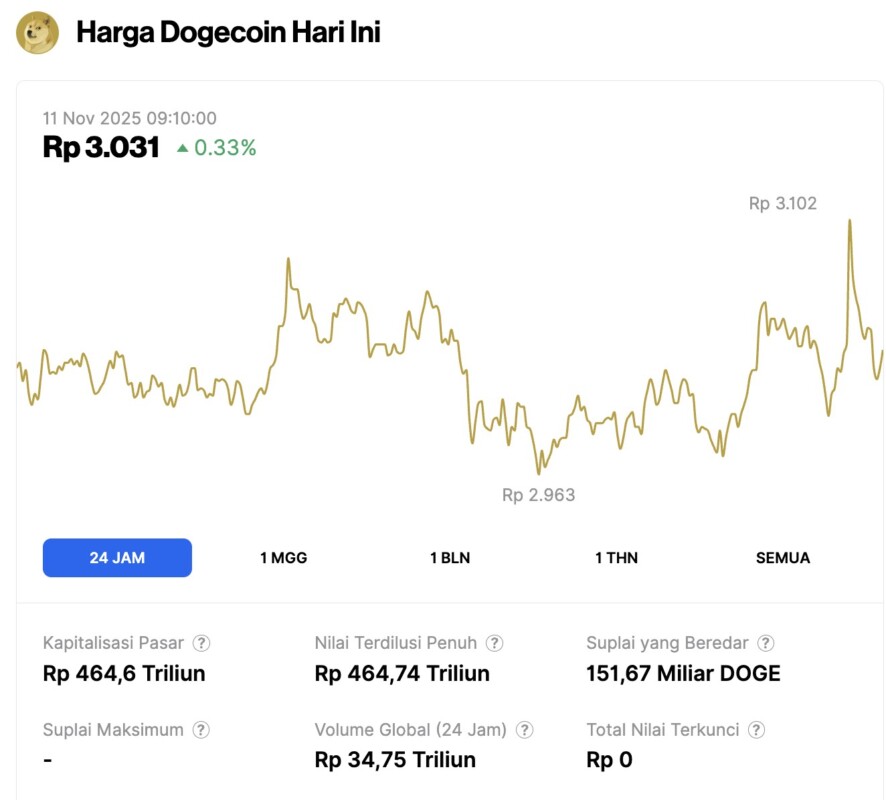
As of November 11, 2025, Dogecoin posted a modest 0.33% gain over the past 24 hours, trading at $0.1806 or approximately IDR 3,031. During this period, the price fluctuated between IDR 2,963 and IDR 3,102.
At the time of writing, Dogecoin’s market capitalization is estimated at around IDR 464.6 trillion, with a 24-hour trading volume of roughly IDR 34.75 trillion.
Read also: 3 Altcoins that are in the spotlight right now, what’s the reason?
Rejection at Key Support Indicates Dogecoin’s Bearish Trend
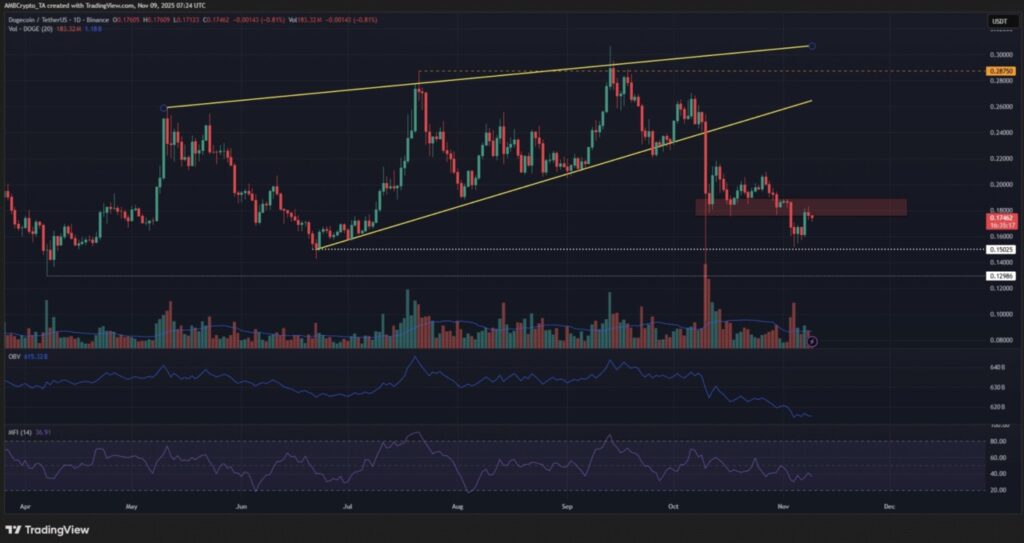
Last week’s bearish prediction proved accurate, with Dogecoin’s price move towards $0.15 now realized. Currently, price rejection from the $0.18 level indicates that seller dominance continues on the daily time frame.
Data from shorter time frames supports this view: both Open Interest and short-term price performance show consistent selling pressure.
The price structure on the daily chart remains bearish, reinforced by the steady downtrend in the On-Balance Volume (OBV) indicator. The Money Flow Index (MFI) also indicates full control is in the hands of sellers.
The combination of these factors reinforces the possibility that the $0.18 level, which was previously support, is now serving as the start of a continued downward movement towards $0.15-and potentially even touching the next area of support at $0.13.
This bearish structure will be invalidated if Dogecoin is able to break back above $0.209.
Read also: Whale Crypto Buys 51 Million Aster Tokens, Will ASTER Price Soar?
Liquidity Data Hints at One Last Squeeze Scenario
The 2-weekly Liquidation Map identifies accumulated liquidity in the $0.19 to $0.204 area. This could potentially be the last short liquidation target before the price resumes its decline to around $0.13.
Monitor for a possible trend change through OBV movement on the daily time frame, combined with a breakout above $0.209 to signal the start of an uptrend.
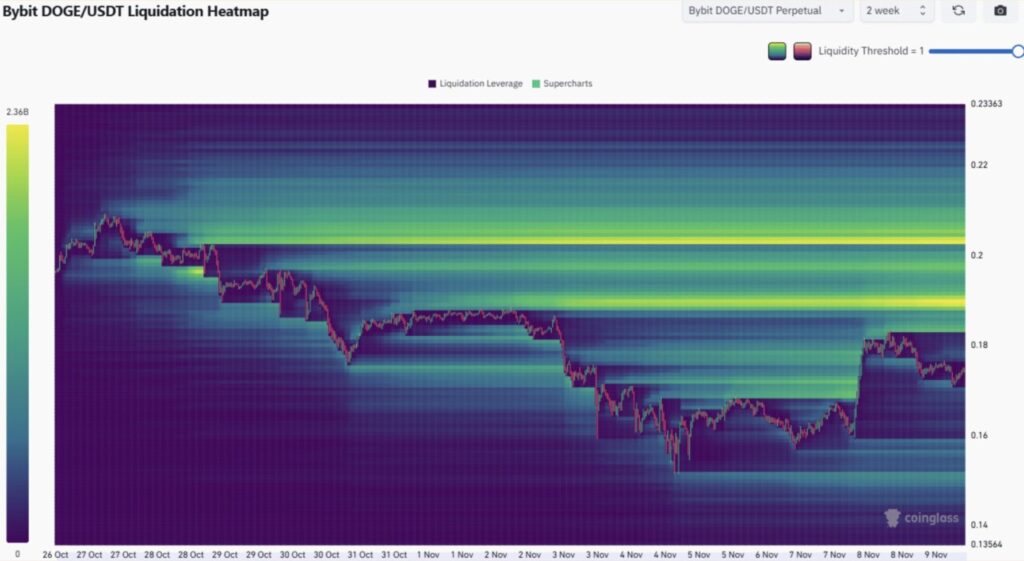
Until that happens, any price increase, even to $0.204, is more likely to be an opportunity for a sell-off.
That’s the latest information about crypto. Follow us on Google News to get the latest crypto news about crypto projects and blockchain technology. Also, learn crypto from scratch with complete discussion through Pintu Academy and stay up-to-date with the latest crypto market such as bitcoin price today, xrp coin price today, dogecoin and other crypto asset prices through Pintu Market.
Enjoy an easy and secure crypto trading experience by downloading Pintu crypto app via Google Play Store or App Store now. Also, get a web trading experience with various advanced trading tools such as pro charting, various types of order types, and portfolio tracker only at Pintu Pro.
*Disclaimer
This content aims to enrich readers’ information. Pintu collects this information from various relevant sources and is not influenced by outside parties. Note that an asset’s past performance does not determine its projected future performance. Trading crypto carries high risk and volatility, always do your own research and use cold hard cash before investing. All activities of buying and selling bitcoin and other crypto asset investments are the responsibility of the reader.
Reference:
- AMB Crypto. Mapping Dogecoin’s path – Price could chase THIS before sliding to $0.13. Accessed on November 11, 2025