Bitcoin Price Surges Past $90K, Buyers Back in Control of the Trend! (11/28/25)

Jakarta, Pintu News – Bitcoin has recently embarked on an impressive recovery wave, breaking through the $90,000 mark. Currently, Bitcoin is in a consolidation phase and seems to be trying to break the $91,500 zone soon.
Bitcoin Price Recovery
After successfully holding above the $86,500 level, Bitcoin (BTC) formed a solid base and started a recovery wave above the $88,000 resistance zone. There was a breakdown of the key bearish trend line with resistance at $88,000 on the hourly chart of the BTC/USD pair. The rise took the pair above the $90,000 level, marking a clear break above the 61.8% Fibonacci retracement level of the move down from $92,872 to $80,595.
Also Read: JPMorgan Predicts Oil Price Fall to $30 by 2027
Consolidation and Further Upside Potential
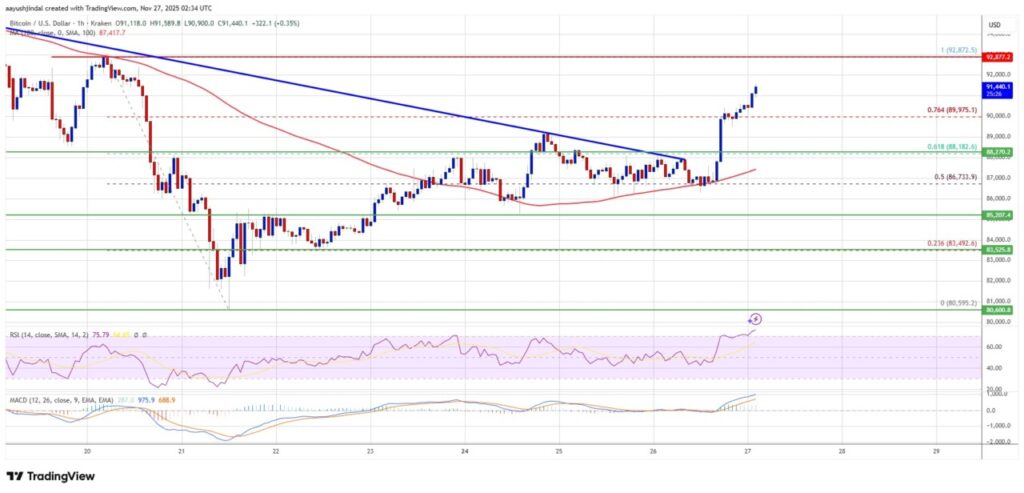
Currently, Bitcoin is trading above $90,500 and the hourly simple moving average of 100. It is also above the 76.4% Fibonacci retracement level of the move down from $92,872 to $80,595. If the buyers continue to dominate, the price may face resistance near the $91,500 level.
The first key resistance is near $92,000, followed by $92,500. A close above the $92,500 resistance could push the price higher again, possibly reaching the $93,750 resistance. A further rise could take the price towards $94,500, with the next limits for buyers being $95,000 and $95,500.
Possible Bitcoin Price Drop
If Bitcoin fails to rise above the $92,000 resistance zone, there could be another drop. Immediate support is near the $89,750 level, with the first major support near $88,500. The next support is now near the $88,000 zone. Further losses could send the price towards the $86,500 support in the short term. The key support is at $85,000, below which BTC might accelerate the decline in the short term.
Technical Indicators
The hourly MACD indicator is now showing acceleration within the bullish zone. Meanwhile, the hourly Relative Strength Index (RSI) for BTC/USD is now above the 50 level. The next major support level is $89,750, followed by $88,000. Meanwhile, the major resistance levels are $92,000 and $92,500.
Conclusion
With technical analysis provided by Aayush Jindal, a market expert with over 15 years of experience, investors around the world get valuable guidance in navigating complex financial markets. This rise in Bitcoin price shows the potential that still exists within the cryptocurrency market, despite its frequent fluctuations.
Also Read: True XRP Holders Keep Calm Amid Weak Markets, Here’s the Outlook for December 2025!
Follow us on Google News to get the latest information about crypto and blockchain technology. Check Bitcoin price today, Solana price today, Pepe coin and other crypto asset prices through Pintu Market.
Enjoy an easy and secure crypto trading experience by downloading Pintu crypto app via Google Play Store or App Store now. Also, get a web trading experience with various advanced trading tools such as pro charting, various types of order types, and portfolio tracker only at Pintu Pro.
*Disclaimer
This content aims to enrich readers’ information. Pintu collects this information from various relevant sources and is not influenced by outside parties. Note that an asset’s past performance does not determine its projected future performance. Crypto trading activities are subject to high risk and volatility, always do your own research and use cold hard cash before investing. All activities of buying andselling Bitcoin and other crypto asset investments are the responsibility of the reader.
FAQ
Q1: What is Bitcoin (BTC)?
A1: Bitcoin (BTC) is the first and most well-known digital currency, often dubbed as a cryptocurrency.
Q2: What is the highest price Bitcoin (BTC) has reached recently?
A2: The highest price recently reached by Bitcoin was $92,872.
Q3: What are the key support levels for Bitcoin (BTC) in case of further declines?
A3: The key support level for Bitcoin in case of further decline is $85,000.
Q4: Who is Aayush Jindal and what is his role in the context of this article?
A4: Aayush Jindal is a market expert with over 15 years of experience in Forex and cryptocurrency trading, known for his sharp technical analysis.
Q5: What are the technical indicators mentioned in the article and what do they mean for Bitcoin (BTC)?
A5: The technical indicators mentioned are MACD and RSI. MACD shows acceleration in a bullish zone, while RSI above 50 shows the relative strength of the market which is positive for Bitcoin.
Reference
- NewsBTC. Bitcoin Price Powers Over $90K. Accessed on November 28, 2025


