Ethereum Slips to $2,700 Today — Sellers Take Control as EMA Becomes Resistance

Jakarta, Pintu News – Ethereum price is hovering around $2,837, down more than 5 percent on December 1 after pressure from sellers led to a strong rejection of the short-term recovery path.
This decline pushed ETH back near the lower boundary of the Bollinger Band and confirmed that momentum is still trending down, following the failure to break back through the 20-day exponential moving average (EMA).
Then, how will Ethereum price move today?
Ethereum Price Drops 1.21% in 24 Hours
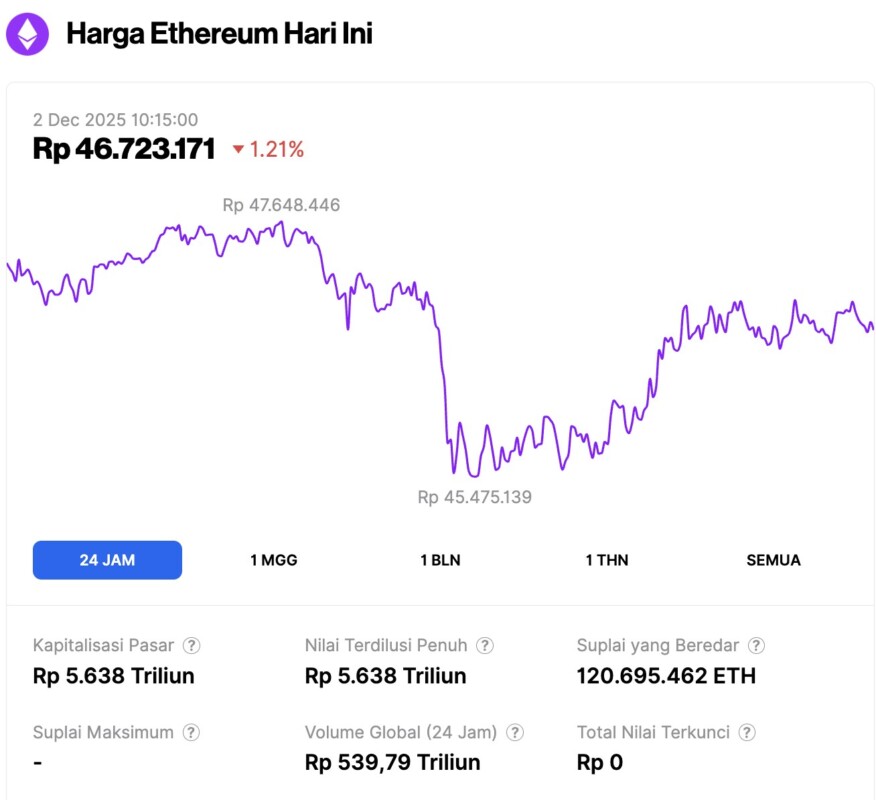
As of December 2, 2025, Ethereum was trading at approximately $2,798, or around IDR 46,723,171 — reflecting a 1.21% decline over the past 24 hours. During this period, ETH reached a low of IDR 45,475,139 and a high of IDR 47,648,446.
At the time of writing, Ethereum’s market capitalization is estimated at IDR 5,638 trillion, while its 24-hour trading volume has surged by 69%, reaching IDR 539.79 trillion.
Read also: Bitcoin Price Hovers at $86,000 Level Today: Can BTC Recover?
Spot Outflows Return as Market Corrects
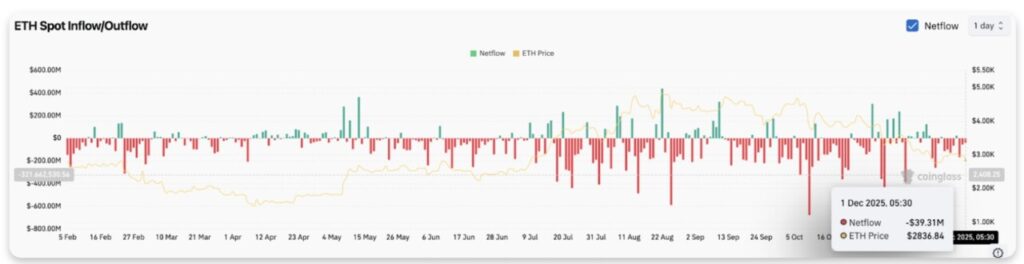
Data from Coinglass shows outflows of $39.31 million on December 1. While this amount is lighter than the massive distribution of Bitcoin , the trend reflects the consistent selling pressure in the Ethereum market throughout November.
The flowchart is dominated by red, confirming that players on the exchange are offloading more positions rather than accumulating.
ETH has not recorded a sustained net inflow since early October, and repeated outflows usually lead to a prolonged correction phase.
Daily Charts Indicate Long-Term Structure Has Been Broken
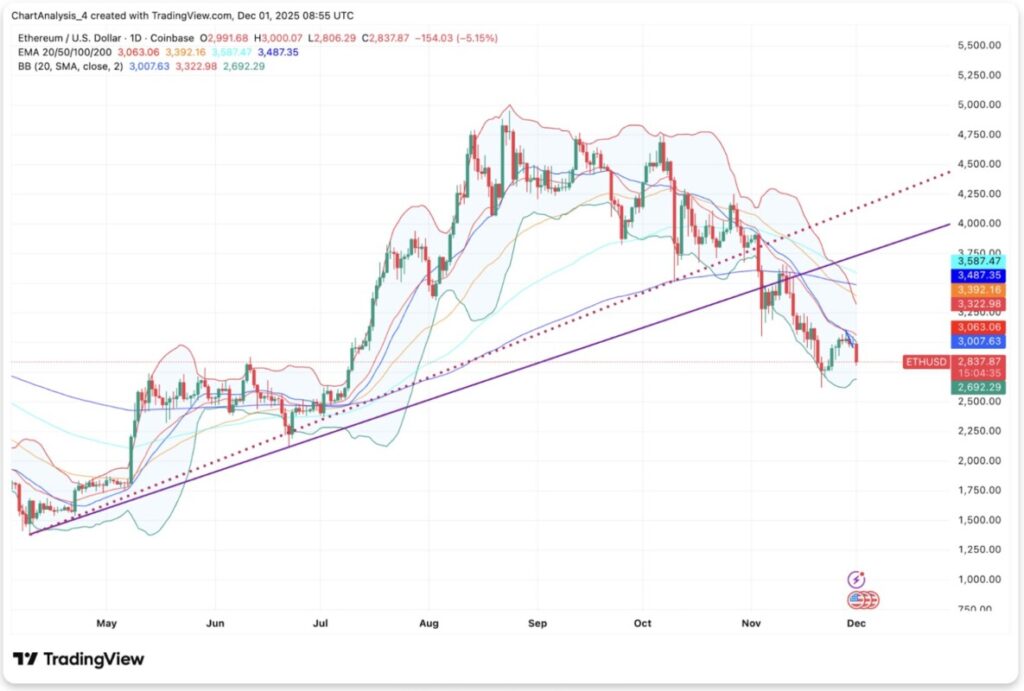
The current ETH price is still below the 20, 50, 100, and 200-day exponential moving averages (EMAs), which range from $3,063 to $3,587. All of these areas have now turned into multiple walls of resistance after ETH broke the long-term uptrend line last month.
The trend line drawn from the previous March low became the backbone of ETH’s 2025 rally. However, its collapse in early November changed the market structure from a “higher lows” pattern to a clear downtrend.
Attempts to retest the downside of this line near $3,200 have failed twice, confirming that buyers have lost control of the macro trend.
The Bollinger Bands indicator shows that the price is sticking to the lower band again after moving to the mean. This indicates that downward volatility has increased again, reinforcing the bearish sentiment.
An important support zone appears in the range of $2,700-$2,690, where the lower band of the Bollinger is in line with the previous liquidity area. If this area is broken, the next major support is around $2,500.
Intraday Weakness Confirms Loss of Short-Term Momentum
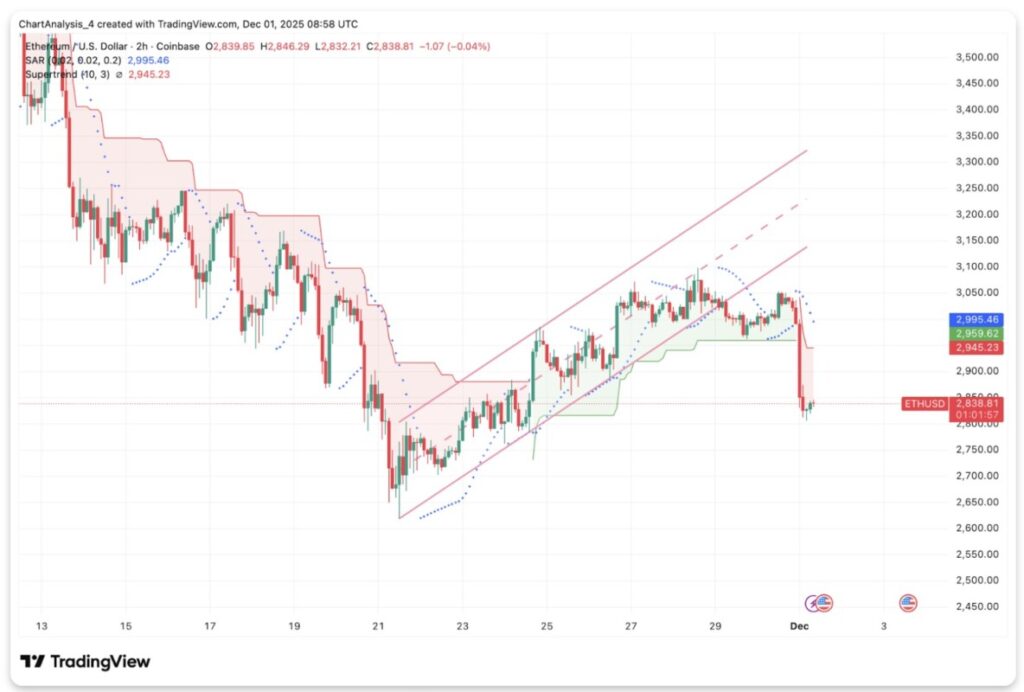
On the two-hour chart (1/12), ETH broke out of the short-term upward channel with a sharp decline. The price broke the Supertrend support at $2,945 and triggered further selling pressure that pushed the price towards the $2,830 area.
The Parabolic SAR indicator continues to appear above the price, signaling continued downward momentum.
Any rebound attempt in the short term is always held back by the resistance on the lower side of the channel that has been broken. This suggests that sellers are still active and defending small levels aggressively, as seen on the larger time frames.
Read also: Why is Crypto Dropping? This is why the crypto market is collapsing today!
A rebound towards $2,960 could be an early signal of short-term stabilization, but a change in momentum will only occur if the price is able to close above the Supertrend band and the SAR signal begins to flatten. Until that happens, ETH is expected to remain in a controlled downtrend.
Derivatives Show Light Leverage Release as Traders Reduce Exposure
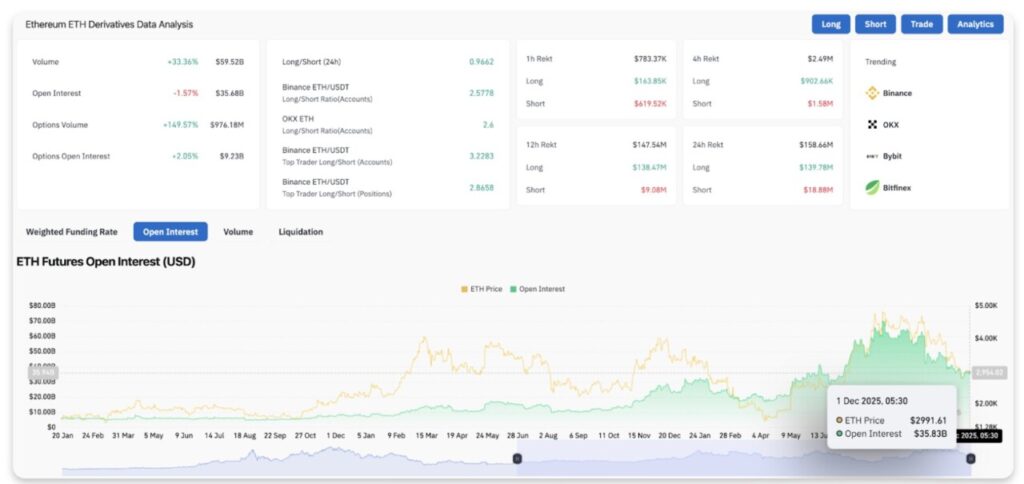
Ethereum derivatives market data shows a 1.57% drop in open interest to $35.68 billion, indicating that leveraged exposure is starting to reduce. Although the movement is small, it is still significant as it comes after several days of a surge in long positions.
The long position ratio of top traders on Binance and OKX is still high, ranging from 2.5 to 3.2. This shows that most large accounts placed bullish positions before the price fell sharply. When the price falls in the opposite direction of a solid long position, the unwind process usually takes place faster.
Total liquidation is still relatively low, but the distribution between the liquidation of long and short positions shows continued pressure on the long side, rather than increased aggression from short positions.
Along with outflows in the spot market, the unwinding of these derivatives reinforces the reason to remain cautious.
Outlook: Will Ethereum Price Rise?
Ethereum needs to recover strongly and break back the $3,063 level to neutralize the short-term downside pressure. Taking back the adjacent EMA area around $3,322 would confirm that buyers are building real momentum, not just a temporary bounce.
- Bullish Scenario: A daily close above $3,063 accompanied by increased volume could open the way towards $3,322 and $3,392. If it manages to break the 200-day EMA at $3,587, then the larger trend structure will be restored, signaling a potential uptrend reversal.
- Bearish Scenario: A daily close below $2,700 will confirm the continuation of the downtrend and opens the risk of a drop to the $2,500 level. If that level is also broken, then there is a high probability that the price could drop down to the $2,330 zone.
Ethereum needs to reclaim the $3,063 level to take control of the trend direction. If it falls below $2,700, then a deeper correction is highly likely ahead of December.
That’s the latest information about crypto. Follow us on Google News to get the latest crypto news about crypto projects and blockchain technology. Also, learn crypto from scratch with complete discussion through Pintu Academy and stay up-to-date with the latest crypto market such as bitcoin price today, xrp coin price today, dogecoin and other crypto asset prices through Pintu Market.
Enjoy an easy and secure crypto trading experience by downloading Pintu crypto app via Google Play Store or App Store now. Also, get a web trading experience with various advanced trading tools such as pro charting, various types of order types, and portfolio tracker only at Pintu Pro.
*Disclaimer
This content aims to enrich readers’ information. Pintu collects this information from various relevant sources and is not influenced by outside parties. Note that an asset’s past performance does not determine its projected future performance. Crypto trading activities have high risk and volatility, always do your own research and use cold cash before investing. All activities of buying and selling bitcoin and other crypto asset investments are the responsibility of the reader.
Reference:
- CoinEdition. Ethereum Price Prediction: Sellers Drive Breakdown And EMAs Turn Into Resistance. Accessed on December 2, 2025