Solana Price Today (12/8) Up 4.90%, 2025 Breakpoint Conference Moves Market Sentiment?

Jakarta, Pintu News – Ahead of the Solana Breakpoint 2025 conference, the Solana price has started to show signs of resurgence after successfully breaking through important diagonal resistance. The crypto market is responding positively to this move, with many traders asking if this momentum can continue until the conference’s summit on December 11-13 in Abu Dhabi.
Breakpoints are one of the biggest events in the Solana ecosystem, so expectations of them often have a direct impact on price. This article looks at how the price structure, technical indicators and context of the event could shape Solana’s near-term trends.
Solana Price Up 4.90% in 24 Hours
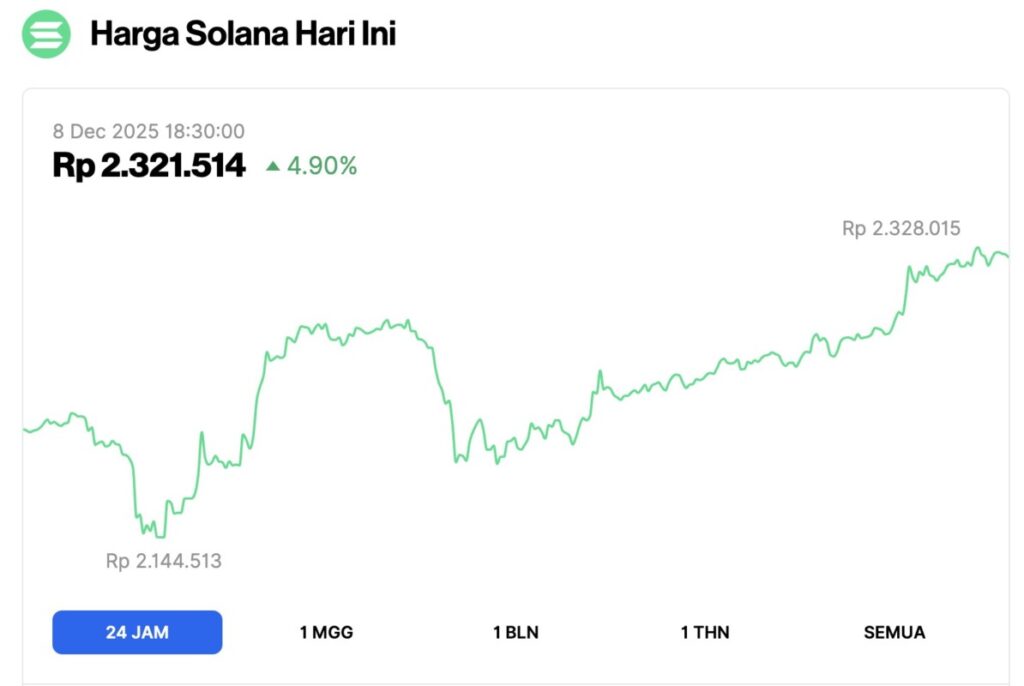
The Solana (SOL) price chart over a 24-hour span shows a consistent recovery pattern after experiencing pressure at the lowest point around IDR 2,144,513. At the start of the period, the price movement was relatively flat before entering a sharp downward phase that signaled increased selling. However, shortly after, SOL recorded a strong rebound that pushed the price up significantly to form an intraday peak. Despite a correction after the peak, the price remained above the support level and showed stabilization.
Entering the second half of the period, the trend moved more positive with a gradual increase that was quite steady. The chart shows a series of higher lows which indicates that buying pressure is starting to increase, strengthening the chances of a short-term uptrend forming. By the end of the period, the price managed to climb up to IDR2,321,514, recording a gain of around 4.90% from the previous day. Overall, the chart depicts a solid technical recovery and increased market interest in SOL in the past 24 hours.
Breakpoint 2025: The Big Conference Driving Market Sentiment
Solana Breakpoint is the largest annual conference that brings together founders, developers, and creators to discuss the latest Web3 innovations. This year’s event will be held in Abu Dhabi from December 11 – December 13, 2025 and will feature key figures such as Anatoly Yakovenko, Ben Zhou, and government officials from the United Arab Emirates.
The participation of these big names adds weight to the event as a potential catalyst for the Solana ecosystem. With community enthusiasm on the rise, many investors see Breakpoint as an important momentum for the network’s development.

SOL’s price movement ahead of the conference showed a recovery from short-term support levels, especially after bouncing off the $130 area or around IDR2,170,000. This bounce came after SOL broke the diagonal resistance that had held the price for 57 days. After the breakout, the price briefly fell back but managed to confirm the resistance as support. This gives room for a potential short-term trend reversal.
Read also: CoinShares: December could be the month to decide the fate of digital asset treasuries, why?
Solana Price Analysis: Breakout Occurs, but Confirmation Still Needed
SOL’s daily price movement confirms a breakout from the downward trend that has been going on since October. With the diagonal resistance now turning into support, the opportunity for further upside is increasingly open. The bounce that occurred right at the $130 support area strengthens the price recovery narrative. However, traders are still waiting for stronger technical signals to confirm the validity of the reversal.

Technical indicators are showing mixed signals. The Relative Strength Index (RSI) has started to rise but remains below 50, signaling that the bullish momentum is not yet fully solid. The Moving Average Convergence/Divergence (MACD) also moved up but is still in the negative zone.
Based on the price structure, a bullish scenario towards $155 is the most plausible possibility. However, SOL needs to close the daily price above this level to strengthen the bullish confirmation.
Long-Term Predictions: Optimism exists, but risks lurk

The weekly chart shows that SOL has bounced off the lower boundary of the long-term range that has been in place for 18 months. This bounce opens up an upside opportunity towards the midpoint of the range, which is around $180 or IDR3,005,000. This level is an important area to test the strength of buyers in the medium term. If broken, the chances of a long-term trend reversal will increase.
Read also: BTC and ETH are green, why are crypto markets up today (8/12/25)?
However, long-term indicators are still dominated by bearish signals. The weekly RSI remains below 50, while the MACD is in negative territory, signaling that seller pressure remains strong. The main risk lies in the potential drop back below $120 or IDR2,003,000. If the support is broken, SOL could fall below $100 or IDR1,669,500, paving the way for a deeper correction. Therefore, traders need to be cautious despite the positive sentiment ahead of the breakpoint.
Conclusion
Solana’s (SOL) price increase ahead of Breakpoint 2025 marks a potential trend reversal after a long period of pressure. The breakout from diagonal resistance and the bounce off $130 support are positive early signs, although confirmation is still needed from technical indicators and key price levels. With the Breakpoint approaching, SOL is in a crucial phase that could determine the next direction of movement in the cryptocurrency market.
FAQ
What caused the Solana (SOL) price to rise ahead of the 2025 Breakpoint?
The rise was triggered by the breakout of diagonal resistance and positive sentiment ahead of the annual Solana conference.
Why is the $130 level important in SOL price analysis?
This level is a strong support area that has been holding prices since April, and a bounce at this point signals a potential reversal.
Do the technical indicators support a bullish trend?
Indicators such as RSI and MACD have started to strengthen, but both are still in neutral to bearish zones so full confirmation is yet to emerge.
What is the short-term bullish scenario for SOL?
SOL needs to break and close above $155 to open up an upside opportunity towards $180.
What is the biggest risk to SOL prices right now?
The main risk is a breakdown below $120, which could pave the way for a deeper drop towards the area below $100.
That’s the latest information about crypto. Follow us on Google News to get the latest crypto news about crypto projects and blockchain technology. Also, learn crypto from scratch with complete discussion through Pintu Academy and stay up-to-date with the latest crypto market such as bitcoin price today, xrp coin price today, dogecoin and other crypto asset prices through Pintu Market.
Enjoy an easy and secure crypto trading experience by downloading Pintu crypto app via Google Play Store or App Store now. Also, get a web trading experience with various advanced trading tools such as pro charting, various types of order types, and portfolio tracker only at Pintu Pro.
*Disclaimer
This content aims to enrich readers’ information. Pintu collects this information from various relevant sources and is not influenced by outside parties. Note that an asset’s past performance does not determine its projected future performance. Crypto trading activities have high risk and volatility, always do your own research and use cold cash before investing. All activities of buying and selling bitcoin and other crypto asset investments are the responsibility of the reader.
Reference
- CCN Solana (SOL) Price Breaks out Ahead of Breakpoint – Can the Rally Continue Into the Conference. Accessed December 8, 2025
- Featured Image: Cryptodnes