SEI’s Outlook for 2026–2030: Could This Be the Start of a Bullish Run?

Jakarta, Pintu News – Like many other projects, this year has been a disappointing period for SEI. Since the beginning of the year (YTD), the price of Sei has plummeted by almost 70% and it seems unlikely that these losses can be recovered before the end of 2025.
However, looking at the current situation, it is possible that things will change next year. Why is this the case? Well, this article will discuss the reasons why SEI price predictions for 2026 could be optimistic or bullish.
Here, you will also find out the price targets that the coin might reach in 2026, 2027, and 2030, according to CCN’s report.
SEI Price Prediction 2026-2030
In this section, we will reveal the price levels that SEI is expected to reach in 2026, 2027, and 2030, based on CCN’s report. However, it is important to note that all these predictions are subject to change, given the high volatility of the market.
Read also: Is XRP Price Ready to Rebound? These 3 Signals Show the Bounce!
SEI Price Prediction in 2026
In 2026, SEI prices will probably try to recover most of the losses incurred throughout 2025. One of the driving factors is the expected increase in demand for layer-1 coins.
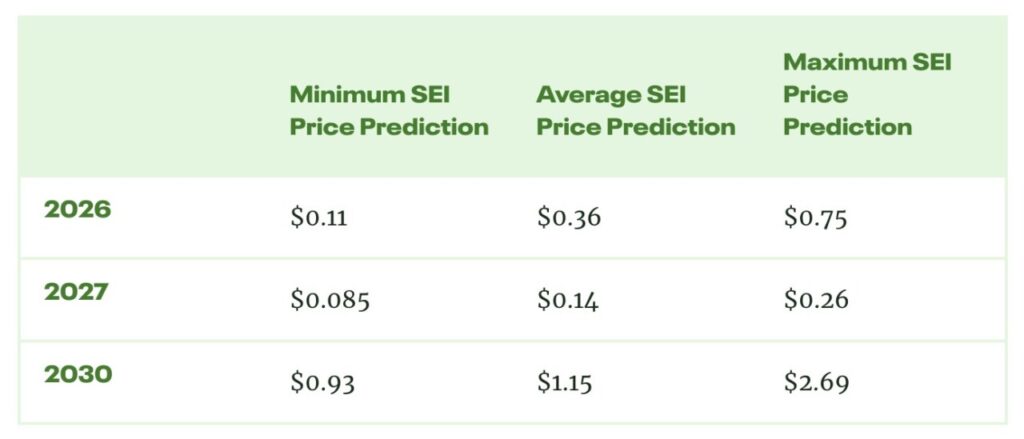
Therefore, during this period, the price of SEI can be expected to drop to $0.11 under unfavorable market conditions. However, if the market experiences a strong bullish trend, the value could potentially surge up to $0.75.
SEI Price Prediction in 2027
The year 2027 will likely not be as strong as 2025 for SEIs. By then, the flow of liquidity into the crypto market is predicted to decrease.
Under these conditions, the SEI price is expected to be in a range between $0.085 to $0.26. On average, the price is likely to be around $0.14.
SEI Price Prediction in 2030
By 2030, the situation could be very different, especially due to the increasing adoption of modular blockchains. This could potentially drive demand for native cryptocurrencies like SEIs.
If this scenario materializes, the SEI price could surpass its record high and reach $2.69. Even in the worst case scenario, the value is expected to remain around $0.93.
SEI Price Analysis
On the weekly chart, the SEI price is still moving in a descending channel pattern. However, the current structure suggests that this altcoin may be preparing to break out of the bearish pattern.
As seen in the chart, SEI is approaching the upper trend line while still maintaining strong support around $0.13. This formation opens up opportunities for the token to test the resistance area in the $0.22 range.
Although there are early signs of strength, the likelihood of a quick breakout is still small. Some technical indicators are still signaling caution.
For example, Holders’ Sentiment has remained negative since August, indicating that long-term market participants have not fully regained their confidence.
This long-lasting pessimism often slows down the continuation of bullish trends, even when prices start to show a potential reversal.
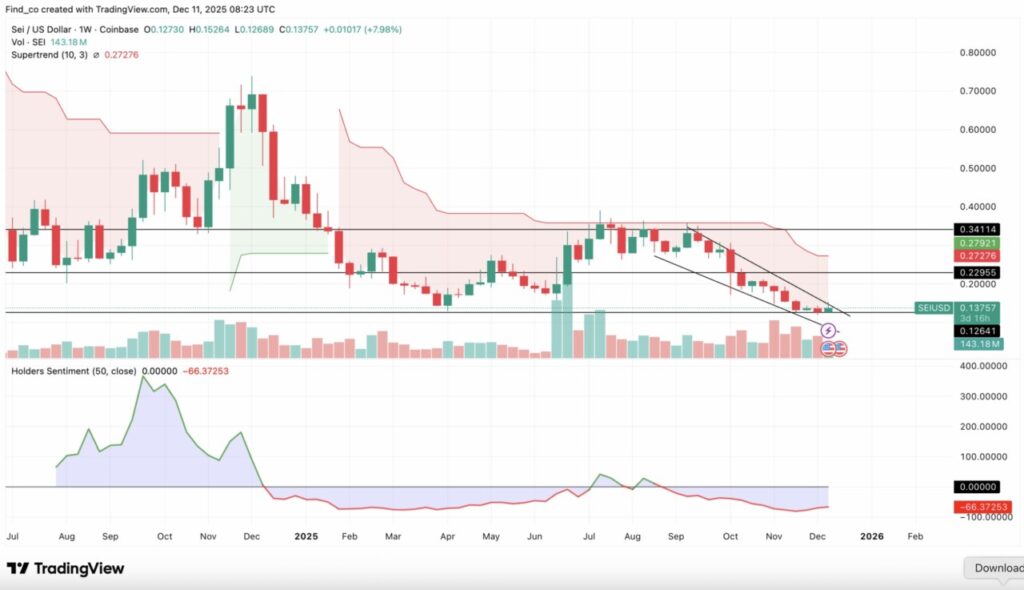
The Supertrend indicator also supports this cautious view. The red Supertrend line is still above the SEI price, signaling that the main trend has not yet reversed to bullish.
As long as SEI hasn’t managed to close the price convincingly above this line, any upside movement will most likely face strong resistance pressure.
Overall, the SEI is showing early signs of a breakout attempt, but the mixed state of the indicators suggests that the price increase is likely to be gradual rather than sharp.
If sentiment improves and SEI is able to break the Supertrend boundary, upside momentum could increase towards $0.34.
However, if not, resistance around $0.22 is likely to be the upper limit of price movement for the time being.
Short Term SEI Price Prediction
As seen on the weekly chart, SEI’s short-term outlook is also bullish. Currently, the altcoin is still in a falling channel pattern.
However, SEI has just bounced off the lower trend line, indicating renewed buying interest, as well as an opportunity to retest the resistance level at the top.
Read also: Ethereum vs Bitcoin: ETH Price Potential to Rise 80% by 2026?
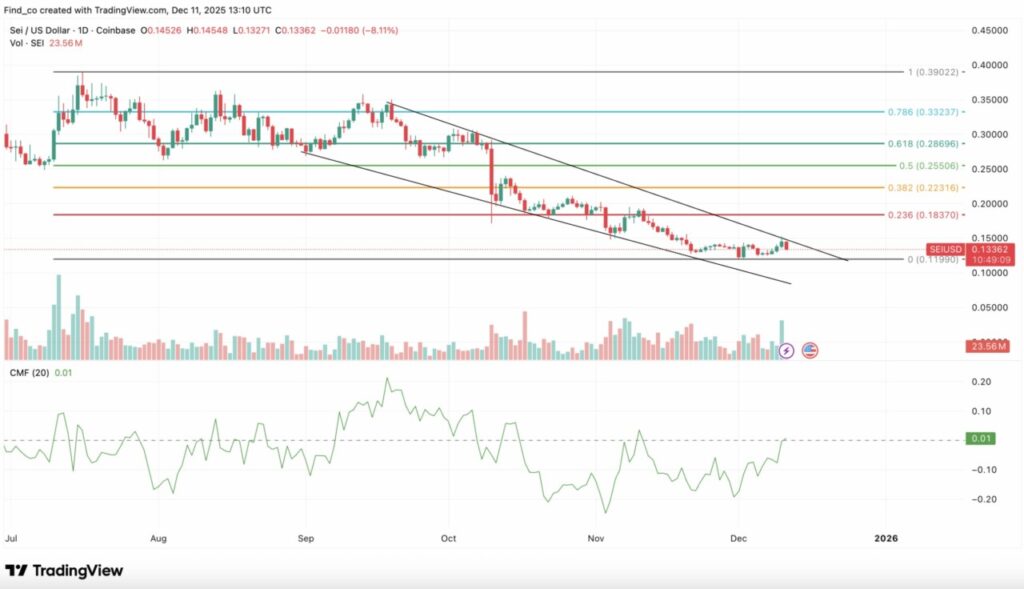
Simultaneously, the Chaikin Money Flow (CMF) indicator has broken above the zero signal line, signaling an increase in buying pressure and a larger influx of capital flows into the market. These changes reinforce the possibility of an upward movement in the near term.
If this trend continues, SEI prices could potentially rise to around $0.18 in the short term.
However, this bullish scenario could be invalidated if selling pressure increases sharply. Under such conditions, SEI risks breaking the key support level and dropping to around $0.10, where the price will likely try to find stability in the lower range.
SEI Market Cap to TVL Ratio
The ratio of Total Value Locked (TVL) to market cap is used to measure the valuation of a decentralized finance(DeFi) project by comparing its market capitalization value to the total assets locked in the project’s smart contracts.
This ratio gives an idea of how highly utilized the platform is, as well as connects the health of the ecosystem to the value of locked assets.
- If the ratio is above 1.0, it indicates that the project is overvalued because the market capitalization is greater than the value of the assets used in the platform.
- Conversely, if the ratio is below 1.0, the project is undervalued as the market value is less than the locked-in asset value.
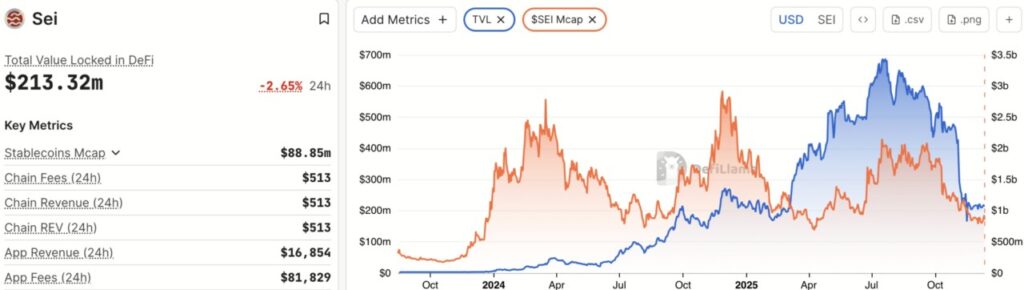
As of this writing, the Market Cap to TVL ratio for SEI stands at 2.35, indicating that SEI is overvalued compared to current market conditions.
CCN Strength Index
The CCN Power Index is an analytical tool that combines various advanced market signals to measure the strength of a crypto asset’s performance in the last 30 days.
Every day, the index assigns a strength score between 0 and 100 to the top 500 crypto assets by market capitalization (data from CoinMarketCap). This assessment takes into account the direction of the trend and the intensity of price movements.
Read also: Raoul Pal Highlights 3 Potential Altcoins That Deserve Your Attention
The following is the interpretation of the index score:
- 0-24: Asset shows significant weakness, indicating a continuing downward trend.
- 25-35: Prices tend to move steadily with low volatility.
- 36-49: The asset is starting to show a steady uptrend, although there are no major spikes yet.
- 50-59: Consistent growth with moderate price increases; starting to build momentum.
- 60+: Sharp price movements and high demand; signaling high volatility and the potential for major trend changes.
The index is dynamic, adjusting to rapid market changes. For example, if an asset jumps 100% in a short period of time, the score will rise sharply to reflect the strength of that rise. However, if the price starts to stabilize at that new level, the score will slowly decrease to reflect the weakening momentum.
The same goes for sharp drops: the score will drop immediately, but slowly readjust as volatility begins to subside.
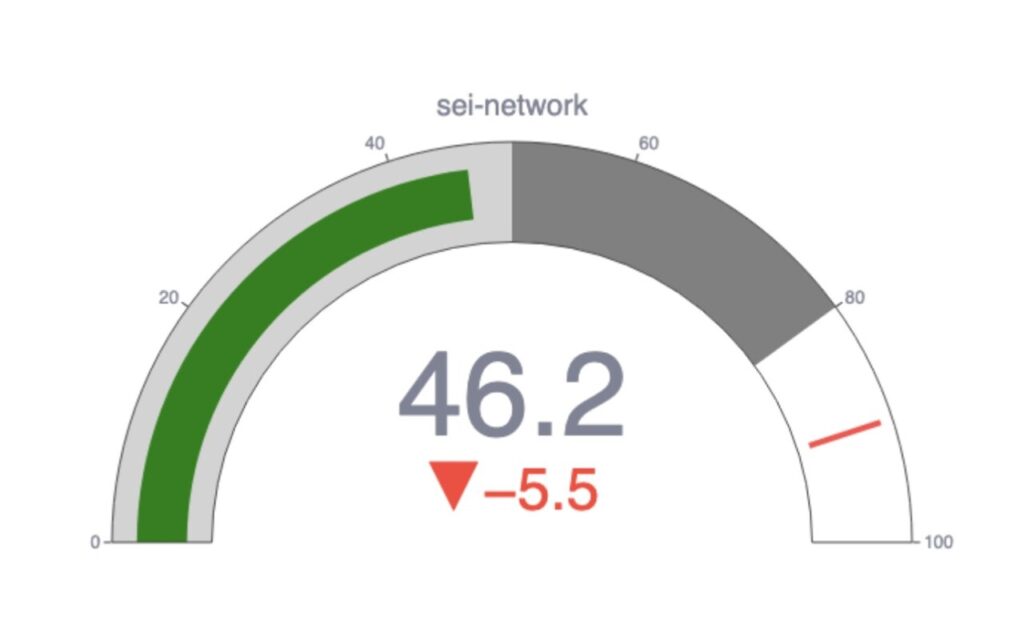
As of December 11, 2025, the SEI scored 46.2 in the CCN Index, indicating that momentum is still weak, although it is starting to lead to a steady uptrend.
That’s the latest information about crypto. Follow us on Google News to get the latest crypto news about crypto projects and blockchain technology. Also, learn crypto from scratch with complete discussion through Pintu Academy and stay up-to-date with the latest crypto market such as bitcoin price today, xrp coin price today, dogecoin and other crypto asset prices through Pintu Market.
Enjoy an easy and secure crypto trading experience by downloading Pintu crypto app via Google Play Store or App Store now. Also, get a web trading experience with various advanced trading tools such as pro charting, various types of order types, and portfolio tracker only at Pintu Pro.
*Disclaimer
This content aims to enrich readers’ information. Pintu collects this information from various relevant sources and is not influenced by outside parties. Note that an asset’s past performance does not determine its projected future performance. Trading crypto carries high risk and volatility, always do your own research and use cold hard cash before investing. All activities of buying and selling bitcoin and other crypto asset investments are the responsibility of the reader.
Reference:
- CCN. SEI Price Prediction 2026: Altcoin Forms Perfect Setup for Bullish Reversal. Accessed on December 12, 2025