Is Bitcoin’s Momentum Starting to Weaken? Here’s the Latest Technical Review (12/15/25)

Jakarta, Pintu News – Bitcoin recently dropped below the $90,000 support zone and is now looking to recover. Upside efforts still face resistance in the $90,500 area, making this phase crucial to assess whether the momentum can regain strength or continue to weaken.
Bitcoin Struggles to Find Stability
Bitcoin failed to maintain strength above $92,000 and $92,500, which triggered a further correction. The price briefly broke below $90,500 and dropped to below $88,000 before buying interest emerged around $87,500. This area formed a new low at $87,582, from which the price bounced.
The initial recovery took the price beyond the 23.6% Fibonacci retracement level of the $93,561 to $87,582 drop. Nevertheless, BTC is still trading below $90,000 and the 100-hour Simple Moving Average (SMA). The sustainability of the recovery will largely depend on the consistency of buyers’ support in this area.
Also Read: Charles Hoskinson Shares Cardano 2026 Big Plan: It’s the Future of ADA!
Potential Increase in Bitcoin Price
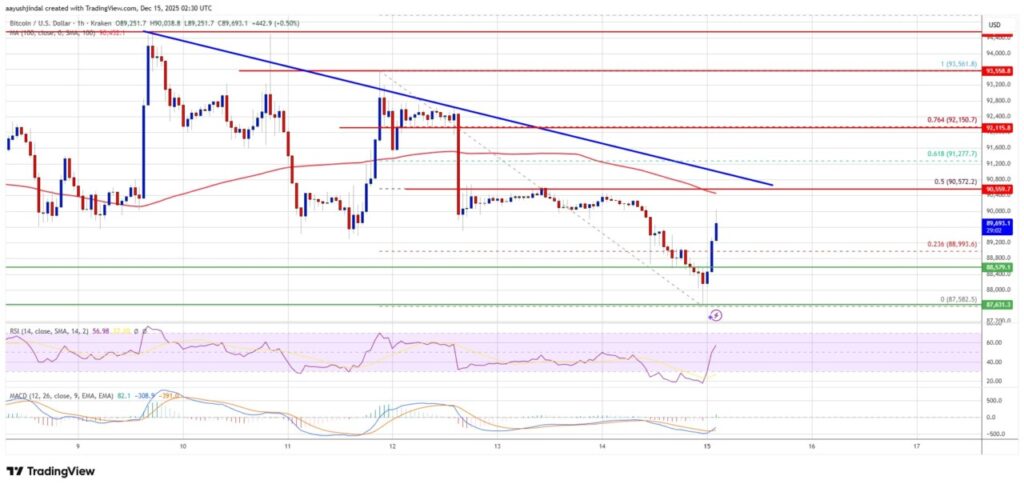
The nearest resistance is around $90,000, with the next key resistance at $90,500. There is also a bearish trend line on the hourly chart of the BTC/USD pair that could potentially limit the upside around $90,650. If this area is broken, the next target is at $92,000.
A break above $92,000 could open up space towards $92,500 and then $93,200. If the momentum continues, the $94,000 to $94,500 area could potentially be the next target, which would strengthen the short-term bullish scenario.
Downside Risk Still Lurks
On the contrary, failure to break the $90,500 resistance could trigger fresh selling pressure. The immediate support is around $88,550, followed by $88,000 as the first major support. The $87.500 area remains crucial as a barrier to further declines.
If selling pressure increases, prices could potentially test $86,500 in the near term. Major support is at $85,000; a break below this level could accelerate weakness and increase the risk of further declines.
Technical Indicators and Analyst Views
The hourly Moving Average Convergence Divergence (MACD) indicator showed increasing momentum in bullish territory. Meanwhile, the hourly Relative Strength Index (RSI) is above the 50 level, indicating relative strength that could support a short-term recovery.
The technical analysis presented by Aayush Jindal-an analyst with more than 15 years of experience in financial markets, especially Forex and crypto-emphasizes the importance of the $90,500 resistance level as the next direction determinant. Evaluation of the current indicators and price structure demands caution until a clearer confirmation of the direction appears.
Also Read: Bitcoin Outlook 2026: Will it Reach $150,000?
Follow us on Google News to get the latest information about crypto and blockchain technology. Check Bitcoin price today, Solana price today, Pepe coin and other crypto asset prices through Pintu Market.
Enjoy an easy and secure crypto trading experience by downloading Pintu crypto app via Google Play Store or App Store now. Also, get a web trading experience with various advanced trading tools such as pro charting, various types of order types, and portfolio tracker only at Pintu Pro.
*Disclaimer
This content aims to enrich readers’ information. Pintu collects this information from various relevant sources and is not influenced by outside parties. Note that an asset’s past performance does not determine its projected future performance. Crypto trading activities are subject to high risk and volatility, always do your own research and use cold hard cash before investing. All activities of buying andselling Bitcoin and other crypto asset investments are the responsibility of the reader.
FAQ
What is Bitcoin (BTC)?
Bitcoin (BTC) was the first cryptocurrency introduced in 2009 and operates on a decentralized blockchain network.
Why did Bitcoin drop below $90,000?
The decline came after the failure to defend the $92,000-$92,500 level which triggered a price correction.
What is the most important resistance level right now?
Key resistances are at $90,000 and $90,500, with further resistance at $92,000.
What is the risk if $90,500 fails to break?
Failure could trigger a drop towards $88,000-$87,500 support and potentially lower.
What indicators are currently supporting the recovery?
The firming hourly MACD and RSI above 50 signal short-term support.
Reference
- NewsBTC. Bitcoin Price Faces Growing Heat. Accessed on December 15, 2025