Antam Gold Price Chart Today December 16, 2025: Up or Down?

Jakarta, Pintu News – The price of Antam gold today again received the attention of market participants after the chart showed a significant movement in mid-December 2025.
Based on data displayed by HargaEmas.com, the dynamics of domestic gold prices are inseparable from movements in world spot gold and the rupiah exchange rate against the US dollar. This information is monitored as an important indicator for the precious metals market in Indonesia.
World Spot Gold Movement in Rupiah
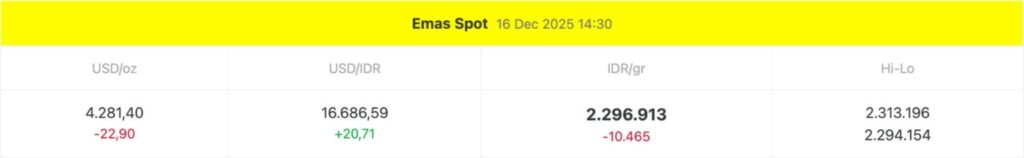
Based on data from HargaEmas.com as of December 16, 2025 at 14:30 WIB, the world spot gold price was recorded at $4,281.40 per troy ounce. This figure experienced a daily decline of $22.90 compared to the previous session, according to international market data. This information is the main reference for global gold price movements.
If converted into rupiah with the USD/IDR exchange rate at IDR16,686.59, the world spot gold price is equivalent to IDR2,296,913 per gram. The data shows a decline of around IDR10,465 on a daily basis, indicating price pressure despite the dollar exchange rate strengthening slightly. This movement is monitored as a combination of global and domestic factors.
Also Read: Ethereum Headed to $5,000: Investment Opportunities Ahead of 2026!
World Gold Intraday Chart Today
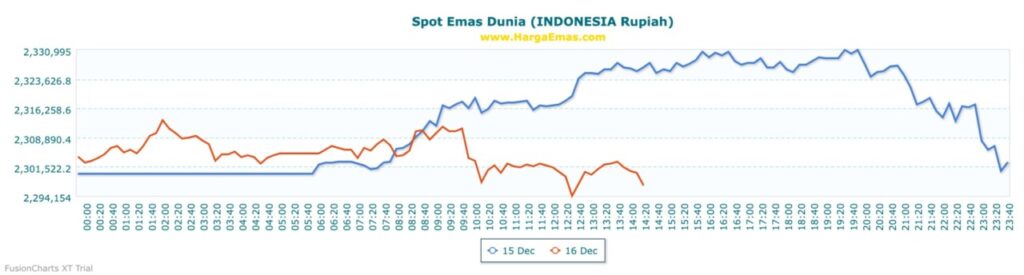
The world gold spot chart in rupiah shows wide fluctuations throughout December 16, 2025. Based on HargaEmas.com visualization, the price moves in the range of IDR 2,294,154 to IDR 2,313,196 per gram. This range reflects intraday volatility which is still relatively maintained.
Chart data also showed selling pressure in the second half of the trading day. According to real-time data, the price was briefly in the upper area before correcting towards the evening. This information is often used as a short-term reference by physical gold market participants.
Antam Gold Price Chart December 2025
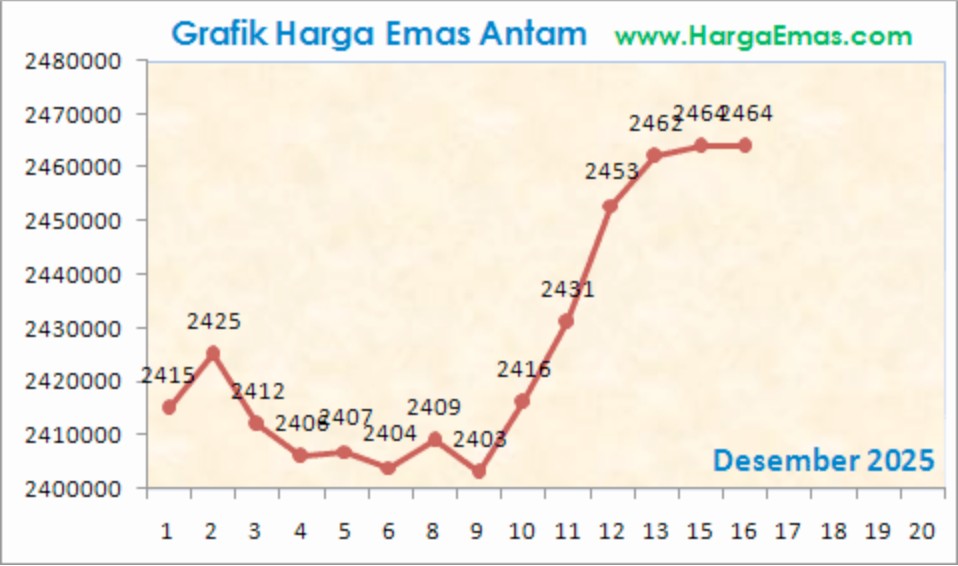
The Antam gold price chart throughout December 2025 shows a different trend from intraday spot gold. Based on the HargaEmas.com chart, the price of Antam gold had moved lower at the beginning of the month in the range of IDR 2,404,000-Rp2,412,000 per gram. The data shows a price consolidation phase.
Entering the middle of the month, Antam gold prices experienced a gradual increase to reach the range of IDR 2,462,000-Rp2,464,000 per gram. This surge occurred in line with the strengthening of global gold prices and adjustments to domestic selling prices. This information is recorded as part of the monthly trend of Antam gold.
Antam Gold and Spot Gold Price Difference
Based on the chart comparison, there is a difference between the Antam gold price and world spot gold. This difference reflects printing costs, distribution, taxes, as well as the pricing policies of producers. HargaEmas.com data shows that the difference is still within a reasonable historical range.
This price gap information is often used as an important metric to understand the price structure of physical gold in Indonesia. As such, today’s Antam gold price chart is not only influenced by global markets, but also non-market domestic factors.
Factors Affecting Today’s Price Chart
According to market data, gold price movements are influenced by a combination of global sentiment, US dollar movements, and monetary policy expectations. Today’s decline in world spot gold prices was recorded along with a limited strengthening of the dollar. These factors are reflected directly on the price chart.
In addition, domestic demand and Antam’s price adjustments also influence the chart. Data from HargaEmas.com shows that Antam’s price changes tend to be more gradual than spot gold, making the Antam gold chart relevant for medium-trend analysis.
Conclusion on Gold Price Movement Today
Today’s Antam gold price chart shows a strengthening trend on a monthly basis despite the daily correction in world spot gold. Based on HargaEmas.com data, price movements are still within a reasonable range and reflect global market dynamics. This information is important as an overview of the current gold market conditions.
By monitoring the Antam gold price chart and world spot gold, market participants can understand the context of price movements without relying on speculation. Visual and historical data are the main basis for reading the direction of the gold market objectively.
Also Read: Bitcoin Stuck Below $94,000: When Will Price Recovery Happen?
Follow us on Google News to get the latest information about crypto and blockchain technology. Check Bitcoin price today, Solana price today, Pepe coin and other crypto asset prices through Pintu Market.
Enjoy an easy and secure crypto trading experience by downloading Pintu crypto app via Google Play Store or App Store now. Also, get a web trading experience with various advanced trading tools such as pro charting, various types of order types, and portfolio tracker only at Pintu Pro.
*Disclaimer
This content aims to enrich readers’ information. Pintu collects this information from various relevant sources and is not influenced by outside parties. Note that an asset’s past performance does not determine its projected future performance. Crypto trading activities are subject to high risk and volatility, always do your own research and use cold hard cash before investing. All activities of buying andselling Bitcoin and other crypto asset investments are the responsibility of the reader.
FAQ
What is Antam gold?
Antam gold is gold bullion produced by PT Aneka Tambang Tbk and officially traded in Indonesia.
Where does today’s gold price chart data come from?
Today’s gold price chart data is taken from HargaEmas.com which displays the world spot gold price and Antam gold.
Why is Antam’s gold price different from world spot gold?
The difference occurs because Antam’s gold includes printing costs, distribution, taxes, and domestic pricing policies.
When is the Antam gold price chart updated?
The Antam gold price chart is generally updated every working day following the official price adjustment from Antam.
What are the risks of reading the daily gold price chart?
Daily charts can show short-term volatility which may not necessarily reflect medium or long-term trends.
Reference
- HargaEmas.com. Gold Price Chart Today. Accessed December 16, 2025