10 Largest Oil Companies in the World

Jakarta, Pintu News – The oil and gas industry remains the backbone of the global economy, despite the world’s shift to renewable energy. Behind the energy supplies that power transportation, industry and everyday life, there are a number of energy giants that control market share on a massive scale.
This article will review the 10 largest oil companies in the world, in terms of their market capitalization, which reflects their financial strength, global reach, and strategic influence in international energy geopolitics.
Saudi Aramco – Market Cap $1,509 Trillion
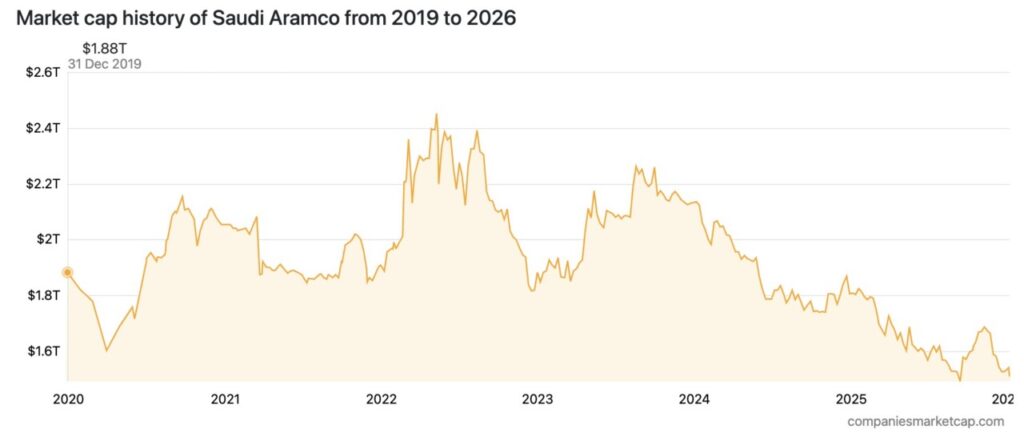
The chart shows the journey of Saudi Aramco’s market capitalization from late 2019 to early 2026, with movements that are quite volatile and reflect the dynamics of the global energy market during the period.
Read also: JPMorgan’s New Breakthrough with JPM Coin on Canton Network!
As of December 31, 2019, Aramco’s market capitalization stood at $1.88 trillion. However, entering 2020, the company’s market value experienced a sharp decline, touching around $1.6 trillion. Thereafter, there was a significant recovery throughout 2020 to mid-2022, where Aramco’s market cap reached its peak, approaching $2.6 trillion.
However, after reaching its peak, Aramco’s market capitalization began to show a downward trend. Throughout 2023 to 2025, the chart shows a series of gradual declines with occasional small rebounds.
Going into late 2025 to early 2026, Aramco’s market capitalization continued to fall and was below $1.6 trillion, marking the lowest position since before 2021. This indicates a decline in investor confidence or continued pressure on the traditional energy sector.
Exxon Mobil (XOM) – Market Cap $522.88 Billion
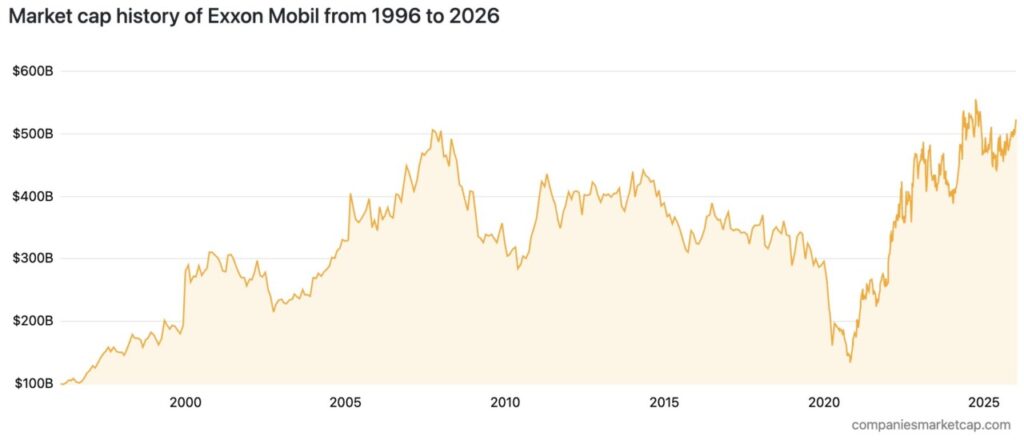
The chart above shows the journey of Exxon Mobil’s market capitalization over the past three decades, from 1996 to early 2026. In the late 1990s, Exxon Mobil’s market value increased significantly from around $100 billion to $300 billion, driven by the growth of its oil and gas business and the merger of Exxon with Mobil in 1999.
Throughout the early 2000s until the 2008 global financial crisis, Exxon Mobil’s market cap continued to climb, peaking at over $500 billion. After the 2008 crisis, Exxon’s market value fluctuated, but remained relatively stable in the range of $400-$500 billion until the mid-2010s.
The low point came around 2020, when Exxon’s market capitalization plummeted to below $150 billion due to the COVID-19 pandemic that hit global energy demand suddenly. However, after that, Exxon Mobil showed a very strong resurgence.
From 2021 to early 2026, market capitalization surged rapidly, even breaking the $500 billion mark again, marking a remarkable recovery.
Chevron – Market Cap $314.11 Billion
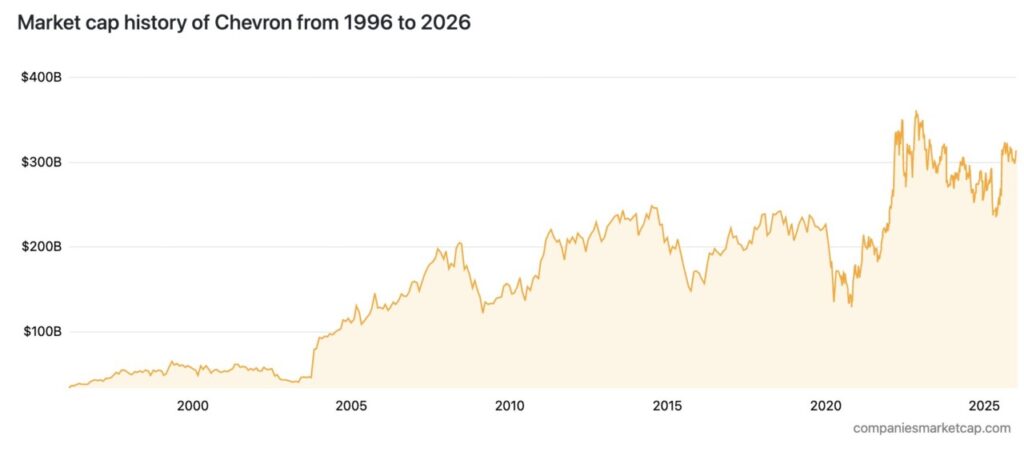
In the late 1990s to early 2000s, Chevron’s market capitalization remained relatively stable at under $100 billion, reflecting the company’s position as a large player but still in a consolidation phase.
A significant spike occurred around 2005, when Chevron’s market value began to rise sharply to over $200 billion. This increase was in line with rising global oil prices and the company’s operational expansion.
Over the next decade, from 2008 to the mid-2010s, Chevron’s market capitalization fluctuated in the $150-$250 billion range. However, a major challenge arose in the run-up to 2020, when Chevron’s market value plummeted dramatically as the COVID-19 pandemic caused oil demand to fall and energy prices to plummet. The lowest point in the chart occurred during this period, below $100 billion, reflecting the extreme uncertainty in the energy sector at that time.
From mid-2020 to early 2026, the company’s market capitalization surged sharply and broke through the $300 billion level, even approaching $350 billion at some points.
PetroChina – Market Cap $259.15 Billion
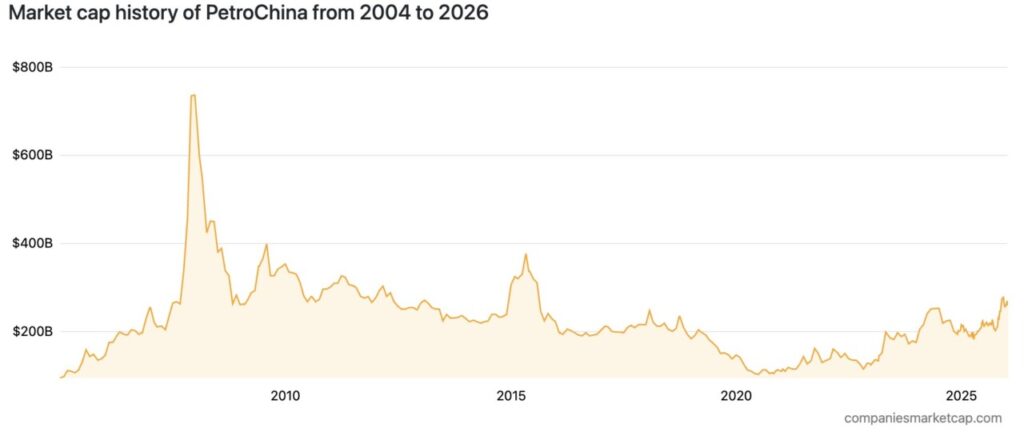
In the early period, PetroChina recorded consistent market cap growth, increasing from around $100 billion to $200-300 billion. However, a remarkable spike occurred around 2007-2008, where PetroChina’s market capitalization peaked at close to $800 billion, making it at the time the most valuable public company in the world.
Read also: Crypto Market Potentially Collapsing Ahead of US Supreme Court Tariff Decision?
However, the valuation boom did not last long. Shortly after reaching the peak, PetroChina’s market cap experienced a drastic decline. Since then, the chart shows a gradual downward trend, although there were some short-term rebounds between 2010 and 2015.
From 2016 to 2020, PetroChina’s market capitalization was in a more steady and lengthy downtrend, even hitting its lowest point below $100 billion. However, from 2021 to early 2026, the chart shows signs of revival. PetroChina’s market cap began to rise, gradually climbing back towards the $200-300 billion range.
Shell – Market Cap $214.48 Billion
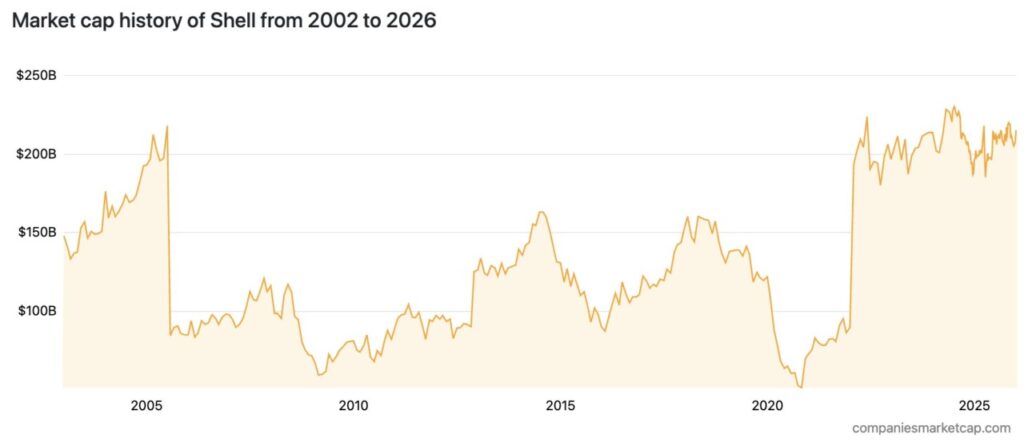
In the early 2000s, Shell’s market capitalization was in the range of $140-150 billion and continued to rise, reaching over $200 billion by 2005. However, around that year there was a sudden sharp decline, dropping the valuation to below $100 billion.
After this period, Shell slowly recovered its valuation. From 2010 to 2014, the company’s market cap rose again and was close to $150-160 billion. The lowest point of the chart occurred in 2020, where Shell’s valuation fell drastically to below $100 billion.
However, since 2021, Shell has shown a very strong recovery. Market capitalization jumped sharply back to above $200 billion, marking a post-pandemic rebound and reflecting recovering global energy demand.
Through 2022 to early 2026, Shell’s market value remains stable in the range of $200-220 billion, reflecting restored investor confidence and the company’s adaptation to new energy trends and operational efficiency.
TotalEnergies – Market Cap $142.73 Billion

In the late 1990s, TotalEnergies’ market capitalization grew gradually from under $50 billion to $100 billion, with a significant spike occurring around 2000.
Throughout the early to mid-2000s, the chart shows a steady upward trend, with TotalEnergies’ market cap peaking at close to $200 billion around 2007-2008.
From 2010 to 2019, TotalEnergies’ market capitalization moved in the range of $100-150 billion. From 2021 to early 2026, TotalEnergies’ valuation increased again towards the range of $150-170 billion, with a volatile but stable trend, reflecting the company’s adaptation to new energy challenges.
CNOOC – Market Cap $133.98 Billion
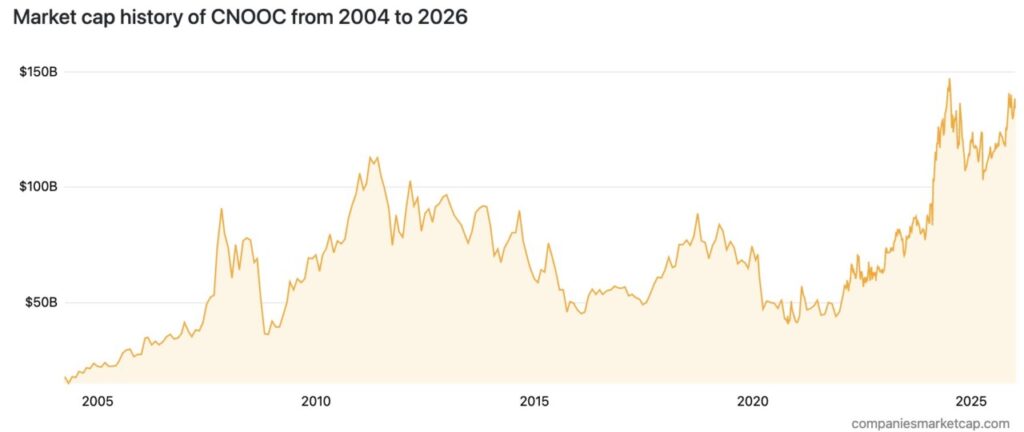
At the beginning of the period, CNOOC had a market cap of under $20 billion, but showed a strong growth trend to reach around $80 billion by 2008.
After the 2008 crisis, valuations fell sharply, but then recovered and increased again, reaching a new peak of around $120 billion in early 2011. Over the next decade, from 2012 to 2019, CNOOC’s market capitalization fluctuated, tending to be on a downward trend, although it remained in the $50-100 billion range.
The lowest point in the chart was seen around 2020, amid the COVID-19 pandemic that caused global energy demand to plummet. However, from that point, CNOOC showed a very strong and consistent recovery, especially since 2021.
From 2022 to early 2026, the company’s valuation skyrocketed to $150 billion, the highest in the company’s history.
ConocoPhillips – Market Cap $120.77 Billion
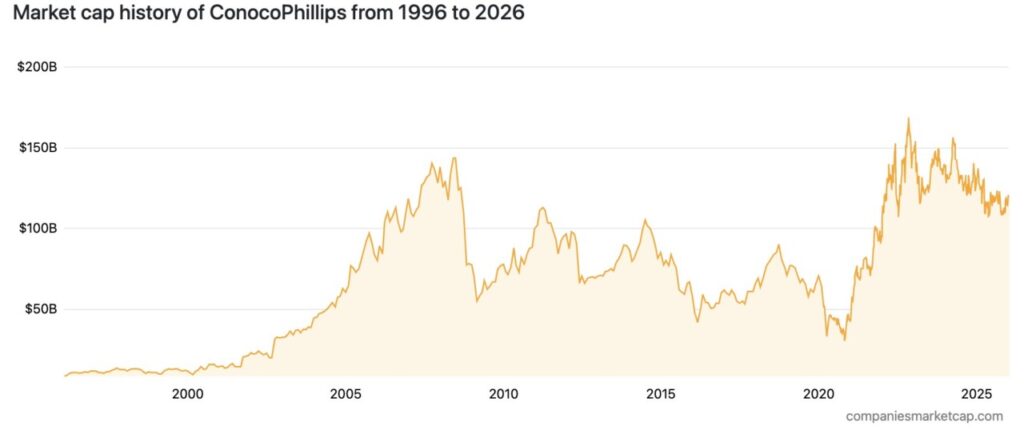
In the late 1990s, ConocoPhillips’ market cap was under $20 billion, but started to show a significant growth trend in the early 2000s. During the period from 2003 to 2008, the chart shows consistent and sharp growth, with market capitalization breaking $140 billion.
From 2010 to 2019, ConocoPhillips experienced a period of considerable fluctuation, moving in the range of $60-110 billion. In 2020, the COVID-19 pandemic brought huge pressure to the energy sector, and ConocoPhillips’ market cap dropped dramatically to below $40 billion.
However, starting in 2021, the company experienced a remarkable resurgence, with its market capitalization soaring and briefly touching nearly $160 billion, marking a new peak in its history.
This recovery was driven by a rebound in oil and gas prices, as well as operational efficiencies and strategic acquisitions, including the purchase of Concho Resources and Shell’s Permian assets. Despite the subsequent correction, valuations remain stable in the range of $120-140 billion until early 2026.
Sinopec – Market Cap $105.28 Billion
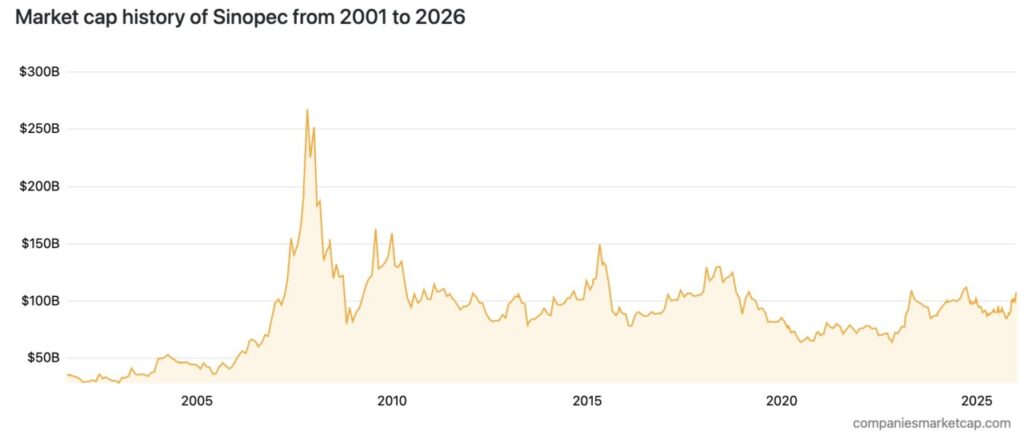
In the early 2000s, Sinopec’s market capitalization was in the range of $30-40 billion. However, from 2006 to 2008, the company experienced a remarkable surge, with valuations breaking through $250 billion, and even approaching $300 billion.
Read also: Wall Street Analysts Update Amazon Stock Price Target – Upside Potential Gets More Attractive
After reaching that peak, Sinopec’s market cap plummeted dramatically in the aftermath of the 2008 global financial crisis, and has never since returned to its previous high. In the following decade (2010-2020), the chart shows a fluctuating pattern with a gradual downward trend, staying within the range of $80-150 billion.
Entering 2020, the COVID-19 pandemic deepened the decline in market capitalization, pushing valuations down to below $70 billion, one of the lowest points in the last 15 years. However, since 2021, there has been a modest recovery that has brought the market cap back above $100 billion, albeit not as strongly as other large energy companies in the post-pandemic rebound phase.
Until early 2026, Sinopec’s market capitalization was relatively stable but flat, moving around $100-110 billion.
Enbridge – Market Cap $105.04 Billion
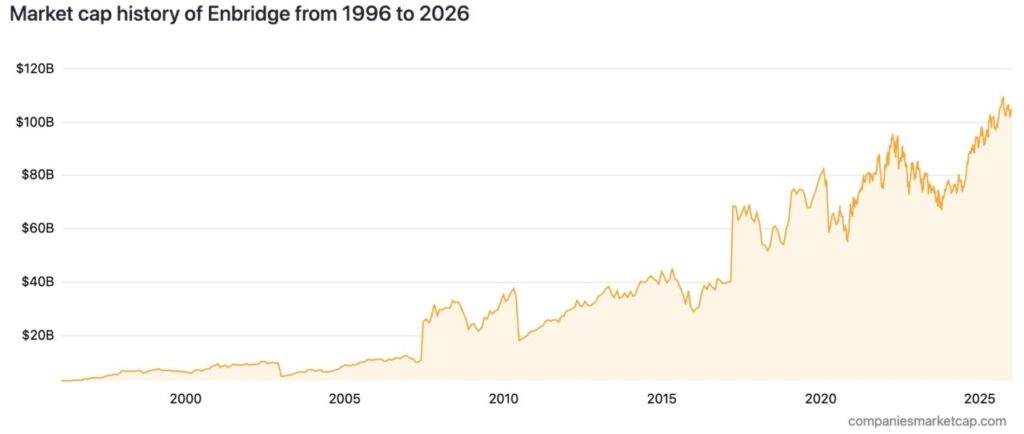
In the late 1990s and early 2000s, Enbridge’s market capitalization grew gradually, from around $5-10 billion, reflecting the early phase of the company’s expansion in the oil and natural gas pipeline sector. Growth began to look more significant after 2005, when valuations began to break $20 billion, as the need for energy infrastructure in North America increased.
The big valuation jump happened around 2017, when the market cap shot up to above $60 billion, and continued its gradual rise to close to $90 billion in the early 2020s. From 2021 to early 2026, the chart shows a very strong recovery and growth trend.
Enbridge’s market cap has surpassed $100 billion and is approaching $110 billion, making it one of the largest energy infrastructure companies in the world.
That’s the latest information about crypto. Follow us on Google News to get the latest crypto news about crypto projects and blockchain technology. Also, learn crypto from scratch with complete discussion through Pintu Academy and stay up-to-date with the latest crypto market such as bitcoin price today, xrp coin price today, dogecoin and other crypto asset prices through Pintu Market.
Enjoy an easy and secure crypto trading experience by downloading Pintu crypto app via Google Play Store or App Store now. Also, get a web trading experience with various advanced trading tools such as pro charting, various types of order types, and portfolio tracker only at Pintu Pro.
*Disclaimer
This content aims to enrich readers’ information. Pintu collects this information from various relevant sources and is not influenced by outside parties. Note that an asset’s past performance does not determine its projected future performance. Trading crypto carries high risk and volatility, always do your own research and use cold hard cash before investing. All activities of buying and selling bitcoin and other crypto asset investments are the responsibility of the reader.


