Solana Price Prediction: $59M Long Liquidation Dragged SOL Down Below EMA Area
Jakarta, Pintu News – Solana price briefly traded around $133.42 after breaking below the 20 and 50-day EMA areas due to a sharp sell-off. This movement triggered a chain liquidation of long positions, which led to the elimination of leveraged positions that were previously established during a period of flat price movement.
Long liquidation accelerates decline
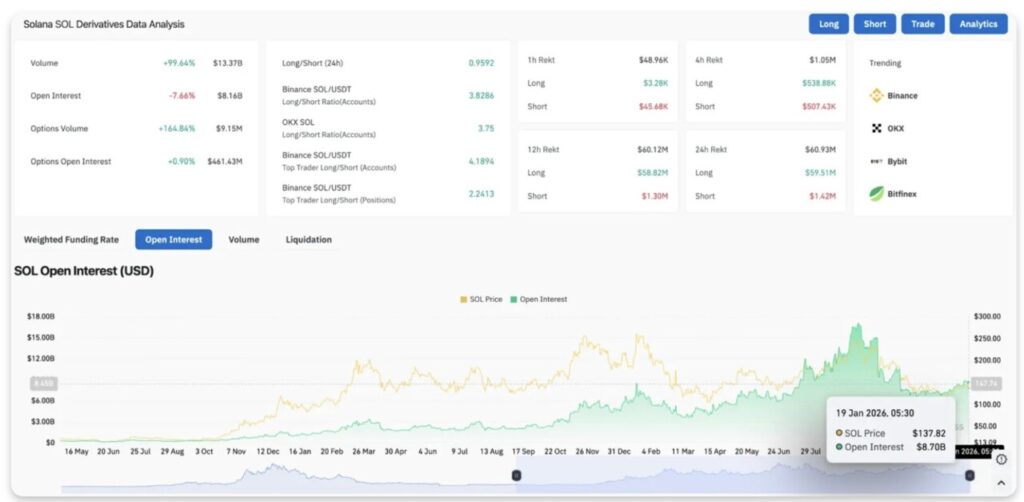
The derivatives market has come under significant pressure in the past 24 hours. According to data from Coinglass, there was a liquidation of $59.51 million worth of long positions, much larger than just $1.42 million for short positions.
Read also: Bitcoin Faces Growing Pressure as 5 Bear Market Indicators Emerge This January
This 42:1 ratio reflects the imbalance of positions formed as many traders anticipated an upward breakout.
Open interest fell by 7.66% to $8.16 billion, while trading volume doubled to $13.37 billion. A drop in OI coupled with an increase in volume signals a forced closing of positions, not a natural sell-off. The leveraged long positions were on the wrong side of the move and were forced out of the market.
The long/short ratio currently stands at 0.95, indicating that market sentiment is starting to lean towards shorts. Top traders on Binance still dominate the long positions with a ratio of 3.82, but the market as a whole has taken a more defensive position.
Spot Outflows Add to Selling Pressure
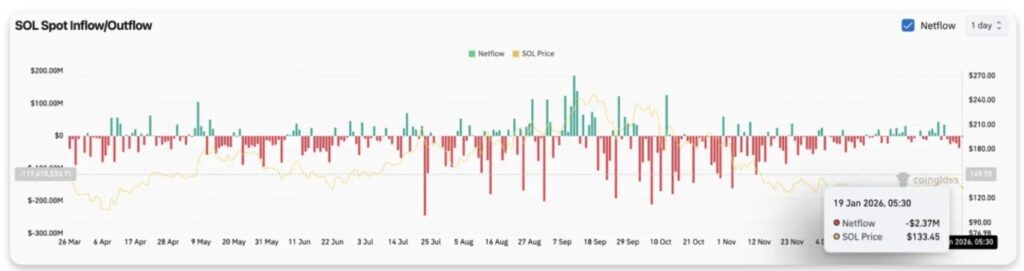
Fund flow data from exchanges showed that holders of spot assets also started to exit the market. Coinglass recorded a net outflow of $2.37 million on January 19, adding to the selling pressure from liquidation in the derivatives market.
When the spot and futures markets both show simultaneous distribution (selling), prices generally tend to continue to fall. As of now, no big buyers have stepped in to absorb the selling pressure, making the demand (bid) side thin as the SOL approaches important support levels.
Price Breaks Below the EMA Area
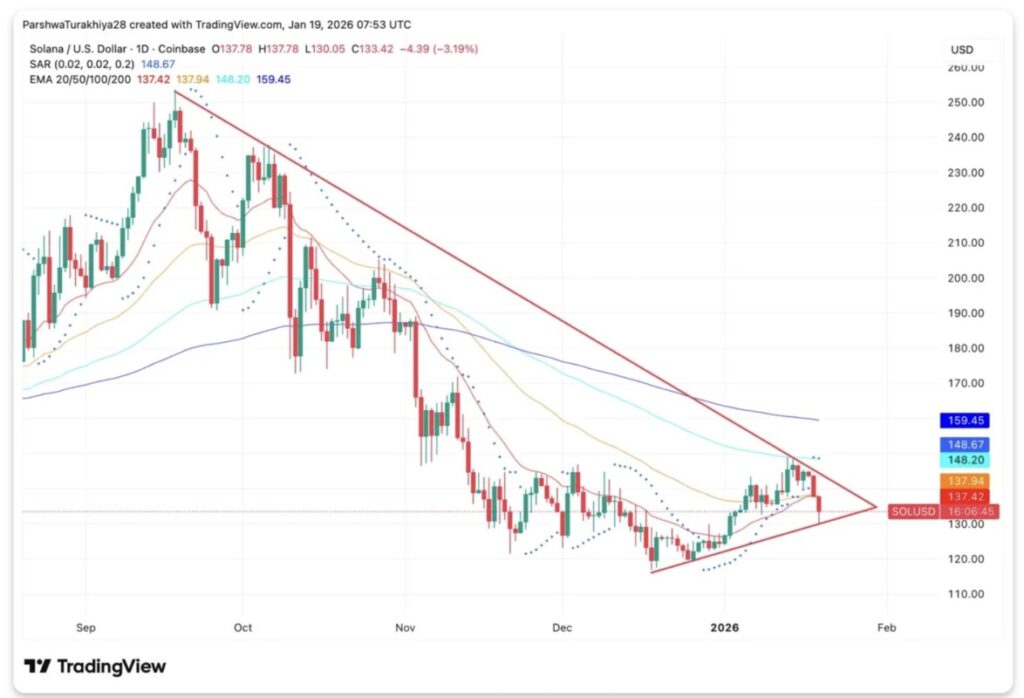
On the daily chart (1/19), Solana has been moving in a falling wedge pattern since its September peak around $250. This structure actually suggests a potential bullish move, but it is only valid if the price is able to stay above the EMA area.
However, today’s candle invalidated that scenario. The price broke the 20-day EMA at $137.42 and the 50-day EMA at $137.94 in a single trading session. The Parabolic SAR indicator has also turned bearish at $148.67, confirming that the short-term momentum is now in the hands of sellers.
Read also: 1 Pi Network (PI) Price in Indonesia Today
Current Key Levels:
- Nearest resistance: $137.42 – $137.94 (20/50 EMA cluster)
- Key resistance: $148.20 (EMA 100)
- Trend resistance: $159.45 (EMA 200)
- Current support: $130 (bottom line of wedge pattern)
- Target breakdown: $118 – $120
The lower boundary of the falling wedge pattern near $130 is the last line of defense for the bulls. In the event of a daily close below this level, the wedge pattern is considered a failure and has the potential to bring the price down towards the technical target at around $118.
RSI Touches Extreme Oversold Levels
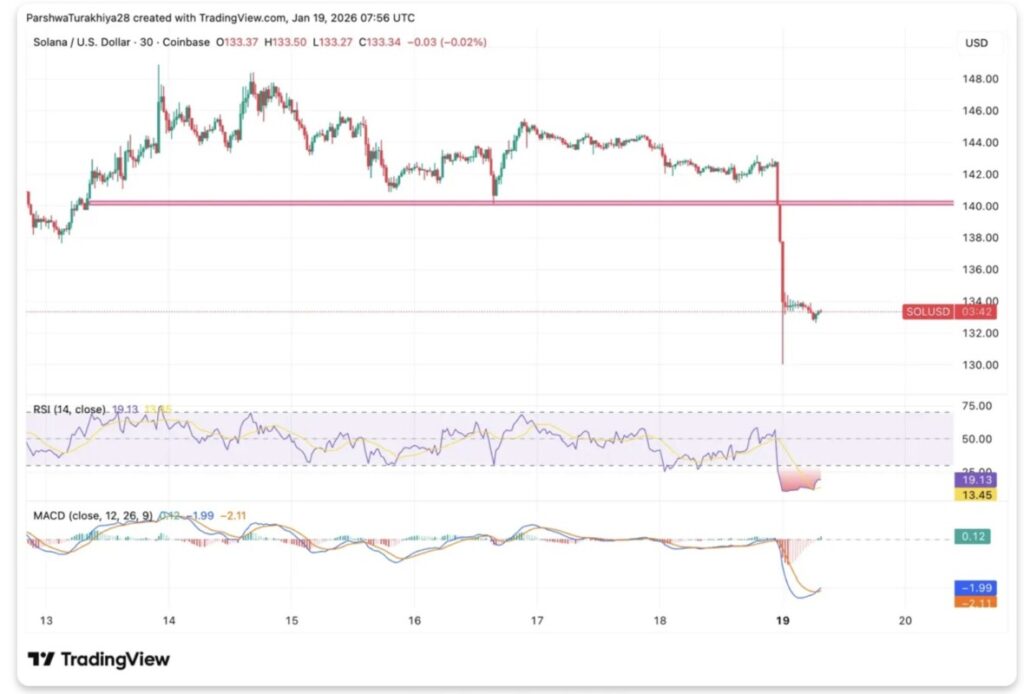
In the shorter time frame, the intensity of the sell-off is evident. On the 30-minute chart, the RSI plummeted to 19.13 – well below the oversold threshold of 30. Extreme readings like this often precede short-term bounces as selling pressure begins to weaken.
Meanwhile, the MACD indicator is still showing bearish signals, with the histogram continuing to widen downwards. The sharp drop from $144 to $130 managed to cleanly break the horizontal support, creating a new resistance zone for the bulls to reclaim.
Any attempt at a price bounce will immediately face resistance at the $140 level. This level previously served as support for most of last week, but it failed to hold today. If the price manages to reclaim $140 strongly, it could be a signal that buyers are starting to defend the market structure again.
That’s the latest information about crypto. Follow us on Google News to get the latest crypto news about crypto projects and blockchain technology. Also, learn crypto from scratch with complete discussion through Pintu Academy and stay up-to-date with the latest crypto market such as bitcoin price today, xrp coin price today, dogecoin and other crypto asset prices through Pintu Market.
Enjoy an easy and secure crypto trading experience by downloading Pintu crypto app via Google Play Store or App Store now. Also, get a web trading experience with various advanced trading tools such as pro charting, various types of order types, and portfolio tracker only at Pintu Pro.
*Disclaimer
This content aims to enrich readers’ information. Pintu collects this information from various relevant sources and is not influenced by outside parties. Note that an asset’s past performance does not determine its projected future performance. Crypto trading activities have high risk and volatility, always do your own research and use cold cash before investing. All activities of buying and selling bitcoin and other crypto asset investments are the responsibility of the reader.
Reference:
- CoinEdition. Solana Price Prediction: $59M Long Liquidations Drag SOL Below EMA Cluster. Accessed on January 20, 2026


