Ethereum Price Tumbles to $2,100 Today: Will ETH Rise or Continue to Crash?

Jakarta, Pintu News – Ethereum dropped to the $2,400 zone after a sharp sell-off pushed the price near the 200-week average and an important long-term trend channel. Currently, ETH is in a high-activity trading zone, where the subsequent reaction will determine the direction of price movement in the short term.
Then, how will Ethereum price move today?
Ethereum Price Drops 10.47% in 24 Hours
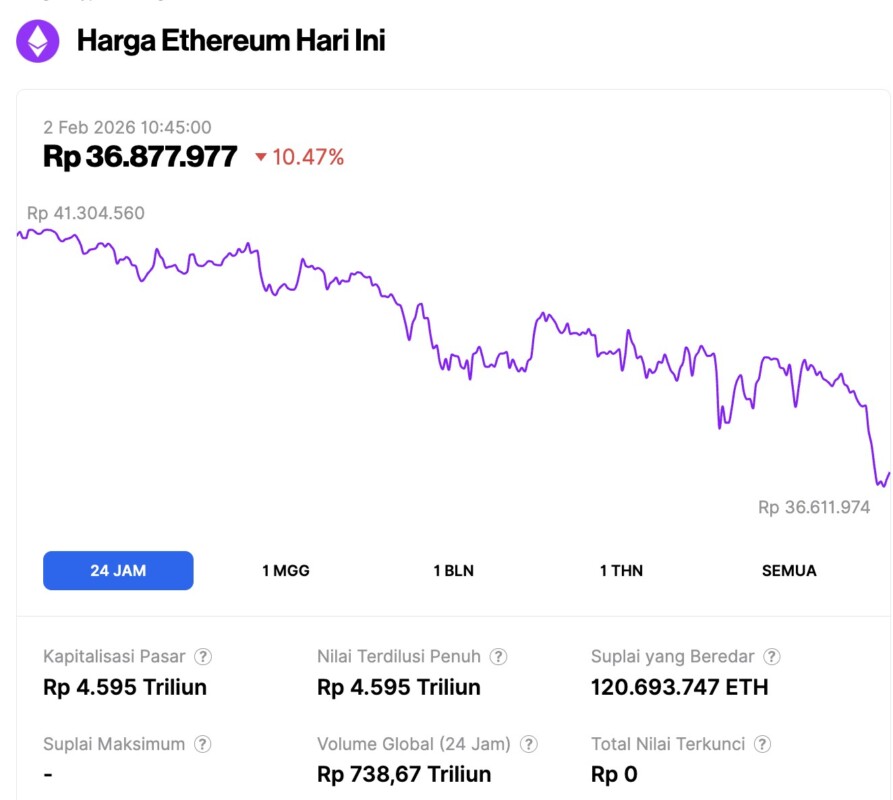
As of February 2, 2026, Ethereum was trading at approximately $2,179, equivalent to IDR 36,877,977 — marking a 10.47% drop over the past 24 hours. During this period, ETH reached a low of IDR 36,611,974 and a high of IDR 41,304,560.
At the time of writing, Ethereum’s market capitalization stands at around IDR 4,595 trillion, while its 24-hour trading volume has declined by 8%, falling to IDR 738.67 trillion.
Read also: Bitcoin Plunges to $74,000, Falling Below Its Fair Value for the First Time!
Ethereum Pulls Closer to Long-Term Trendline, Volume Profile Marks Key Trading Zones
Ethereum continued its decline on the daily chart (1/2), briefly trading around $2,535 after the formation of a sharp red candle that reflected a decline of about 6% in one session on Bitstamp data. This movement is still considered a correction from the August 2025 peak near the $5,000 level, which some analysts call the latest higher high in this cycle.
Crypto analyst Leo Lanza thinks that the drop from the $5,000 area can still be considered part of the uptrend, provided that the higher low structure is maintained. On the chart, Ethereum is now approaching the long-term uptrend channel that started around March 2020.
He notes that the channel has only had two major touchpoints so far, so it still needs confirmation before it is considered a reliable boundary by traders.
The volume profile displayed on the right side of the chart shows the concentration of trading activity at various price levels. Lanza explains that areas with low volume (low volume nodes) are often zones where prices are quickly rejected due to the lack of historical transactions there.
Conversely, high volume nodes are considered reception zones, where denser activity can slow down price movements and create consolidation.
Read also: 3 Altcoins Targeted by Crypto Whale in February 2026, Buy or Release?
Under current conditions, Ethereum is within a high-volume area, signaling that the market has traded heavily in this range and may be treating it as a decision-making zone, rather than simply an empty, uninhibited area. If the price slips into the marked low-volume area, the movement could become faster in either direction due to the thinning liquidity and low prior trading interest.
For now, the chart shows that the market is testing support and structure, with confirmation coming down to how Ethereum behaves around those long-term trend lines and high-volume bands.
Ethereum falls toward 200-week average as traders await bullish response
Ethereum experienced a sharp drop after the latest weekly candle showed significant weakness on the chart. This move brought ETH down to touch the 200-week moving average (200 WMA), a level that has long been monitored as a long-term trend indicator, especially during major corrections.
Market watcher StockTrader Max mentions that this is the point where the bulls “need to show up,” arguing that a bounce off the 200 WMA would quickly improve the technical look on the chart.
He highlights that these averages are often maintained by long-term investors when the market tests them after a prolonged decline.
The chart also shows that Ethereum has slipped below the short-term trend indicator during this sell-off. The 50-week moving average is now above the current price, while the 200-week line is closer to the current price position – creating a zone of high pressure that could be the deciding point as to whether momentum will stabilize or continue to weaken.
If Ethereum is able to hold above its 200-week average and reclaim important levels around it, then this move could be read as asupport test rather than a trend reversal signal.
However, if the price fails to bounce and continues to close below this long-term average, the chart will signal that selling pressure is still dominant and that the previous support is starting to weaken.
Follow us on Google News to stay up to date with the latest in crypto and blockchain technology. Check Bitcoin price, usdt to idr and tokenized nvidia stock price through Pintu Market.
Enjoy an easy and secure crypto trading experience by downloading the Pintu crypto app via Play Store or App Store now. Also, experience web trading with advanced trading tools such as pro charting, various order types, and portfolio tracker only at Pintu Pro.
*Disclaimer
This content aims to enrich readers’ information. Pintu collects this information from various relevant sources and is not influenced by outside parties. Note that an asset’s past performance does not determine its projected future performance. Crypto trading activities are subject to high risk and volatility, always do your own research and use cold hard cash before investing. All activities of buying and selling Bitcoin and other crypto asset investments are the responsibility of the reader.
Reference:
- Coinpaper. Ethereum Price Prediction: ETH Slides to $2.4K, Bulls Defend. Accessed on February 2, 2026


