Bitcoin Breaks $64,000, Selling Pressure Gets Extreme: Where is BTC’s Bottom?

Jakarta, Pintu News – Bitcoin is under pressure again after falling around 13% in four days, from a local peak near US$79,300 to around US$63,844. This level puts BTC below the US$69,000 area which was the peak of the 2021 bull market cycle and has been considered an important support zone.
At the same time, Bitcoin futures open interest plummeted by more than US$10 billion in a week, signaling an aggressive leverage reset. This led analysts to start focusing on long-term technical zones and on-chain indicators to look for possible price turning points.
US$69,000 Zone and US$58,000-US$69,000 Demand Area
The US$69,000 level is important because it is the peak of the 2021 bull market and historically, previous cycle peaks often act as support in subsequent bear phases. In the previous cycle, Bitcoin (BTC) briefly formed a bottom around the 2017 peak of US$19,600 before dropping slightly lower to around US$16,000 in November 2022.
This pattern suggests that the price could break below the old peak before actually forming a bottom. This means that the risk of further structural decline is still open.
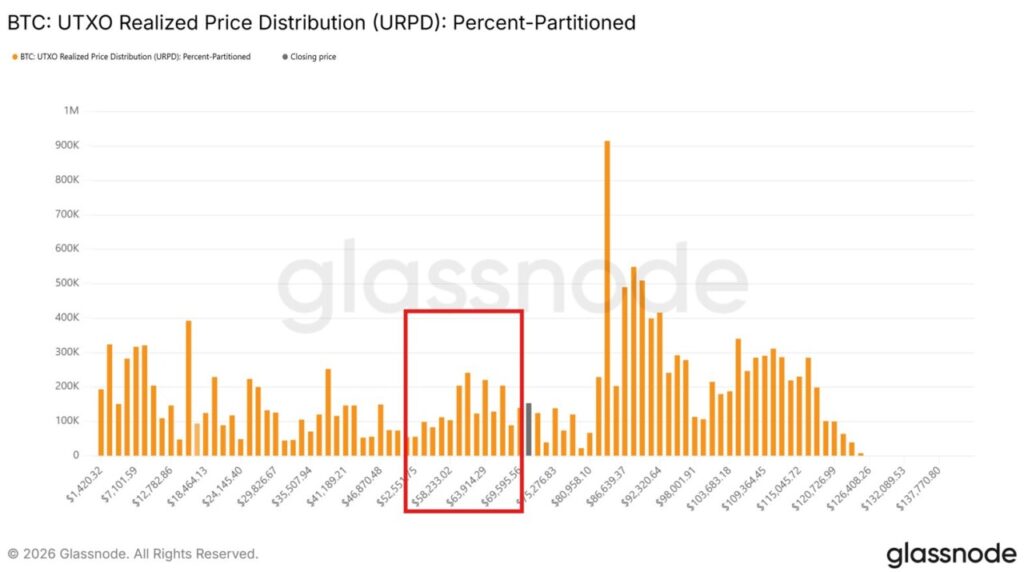
Bitwise’s André Dragosch noted that a large portion of the latest transactions took place in the US$58,000-US$69,000 range. This range coincides with the 200-week moving average around US$58,000, so it is seen as a key demand zone.
On the order book, exitpump analysts also see a large bid in the US$68,000-US$65,000 range, indicating buying interest on any dips into that area. However, the strength of this zone will only be confirmed if the selling pressure subsides and there is a sustained bounce.
Read also: Bitcoin’s chances of breaking $90,000 are slim, options market already “throwing up its hands”?
Extreme Oversold Signals on RSI and aNUPL
Subu Trade market analysts note that Bitcoin’s weekly Relative Strength Index (RSI) indicator has dropped below 30, a region that has historically rarely been touched. BTC has only touched this oversold level four times, and on each of the previous occasions the price rose by around 16% on average in the following four days. This data suggests that the selling pressure is nearing a technically saturated point, although it doesn’t guarantee precise rebound timing.
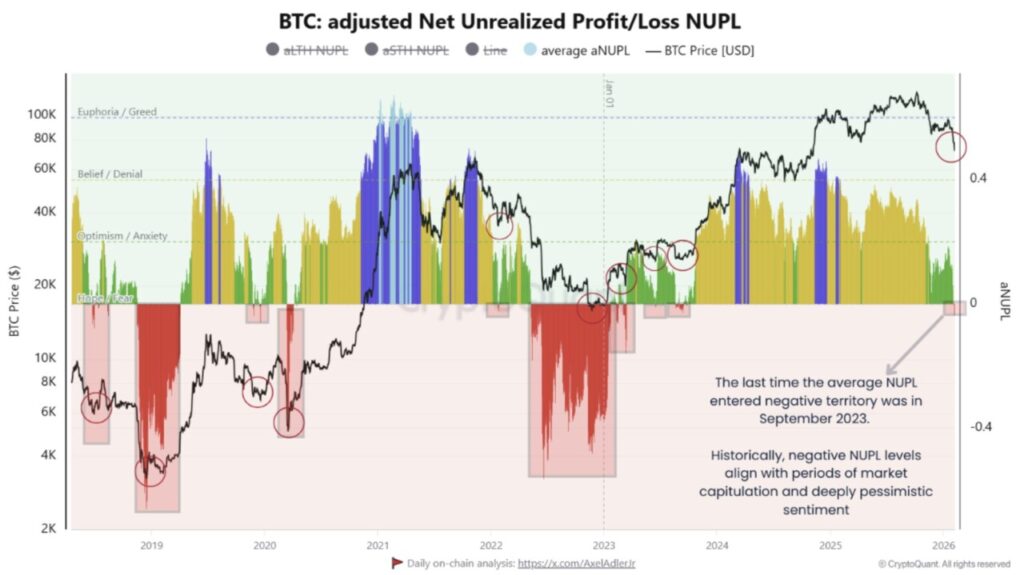
On the on-chain side, MorenoDV analysts highlight that adjusted Net Unrealized Profit/Loss (aNUPL) has gone negative for the first time since 2023. This means that, on average, Bitcoin holders are now at a mark-to-market loss.
Similar situations in 2018-2019, 2020, and 2022-2023 in the past tended to be followed by a price recovery phase. Moreno added that this time around, the sentiment drop happened much faster than in previous cycles, which could mean that the capitulation phase was shorter but more brutal.
Also read: Bitcoin Slumps to $60,000, MicroStrategy Now Hunted for “Catastrophic” Risk
Short-term pressure high, but relief rally potential strong
The combination of sharp price declines, massive leverage resets, and oversold signals across multiple indicators suggests very strong short-term pressure. The decline in open interest by more than US$10 billion in seven days emphasizes that many futures positions have been forced to close. Under these conditions, there is room for a technical relief rally, especially if the US$58,000-US$69,000 demand zone proves to be able to withstand further declines.
However, there is no certainty that the bounce will be immediately strong or lead to a major trend reversal. The experience of previous cycles shows that prices can fluctuate wildly around the bottom zone before a new trend is established.
For market participants, the main focus now is to monitor whether aggressive buyers actually emerge in the US$58,000-US$69,000 area, and whether on-chain signals such as aNUPL recover to positive territory. As long as that hasn’t happened, the risk of a retest of the lower area remains to be anticipated.
Conclusion
Bitcoin’s (BTC) plunge below US$64,000 and break of the historical US$69,000 level marked the most intense phase of selling pressure since late 2022. However, along with it came a series of oversold signals from the weekly RSI and aNUPL that historically often precede price recovery phases.
The US$58,000-US$69,000 zone is now a key area to test the strength of long-term demand. If buyers are able to defend this region, the chances of a relief rally increase; otherwise, the market should prepare for a scenario of forming a deeper and longer bottom.
Follow us on Google News to stay up to date with the latest in crypto and blockchain technology. Check Bitcoin price, usdt to idr and tokenized nvidia stock price via Pintu Market.
Enjoy an easy and secure crypto trading experience by downloading the Pintu crypto app via Play Store or App Store now. Also, experience web trading with advanced trading tools such as pro charting, various types of order types, and portfolio tracker only at Pintu Pro.
*Disclaimer
This content aims to enrich readers’ information. Pintu collects this information from various relevant sources and is not influenced by outside parties. Note that an asset’s past performance does not determine its projected future performance. Crypto trading activities are subject to high risk and volatility, always do your own research and use cold hard cash before investing. All activities of buying and selling Bitcoin and other crypto asset investments are the responsibility of the reader.
Reference
- Cointelegraph. Bitcoin slips under $64K as record-high selling intensifies: Where is the bottom?. Accessed February 6, 2026.
- Featured image: Generated by AI
Latest News

UBS Gold Price Today, April 29, 2026