7 Solana (SOL) Facts: Plummeted 27% to IDR1.35 Million, Can It Still Reach IDR2.5 Million?

Jakarta, Pintu News – The price of Solana is back in the spotlight of crypto market participants after plummeting to its lowest level in two years. This sharp decline has sparked investor concerns, but on the other hand, it has also led to discussions about the chances of a medium-term recovery. According to the latest technical analysis, Solana’s market structure remains fragile, but a recovery scenario remains open if key levels are recaptured.
1. Solana Drops Sharply by 27% in Short Time
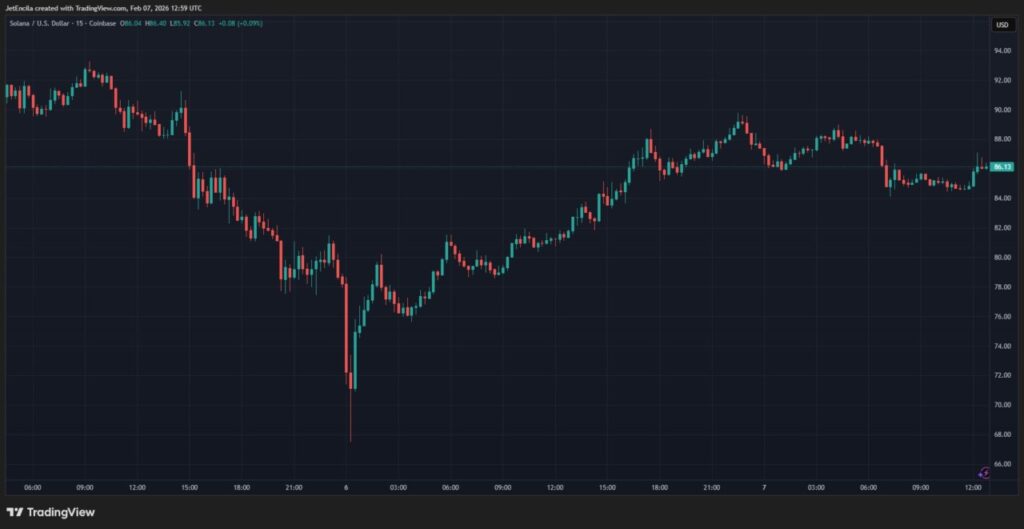
The price of Solana experienced a sharp decline after losing several important support levels. The SOL even fell below USD80 or around Rp1.35 million, marking the lowest point since the last two years.
This decline comes in line with the general weakening of the crypto market. This makes high price levels even more vulnerable to selling pressure.
Also Read: 5 Fun Facts: Bitcoin Often Rebounds in February – Lessons from Historical Data
2. USD100 level loses its role as a strong area
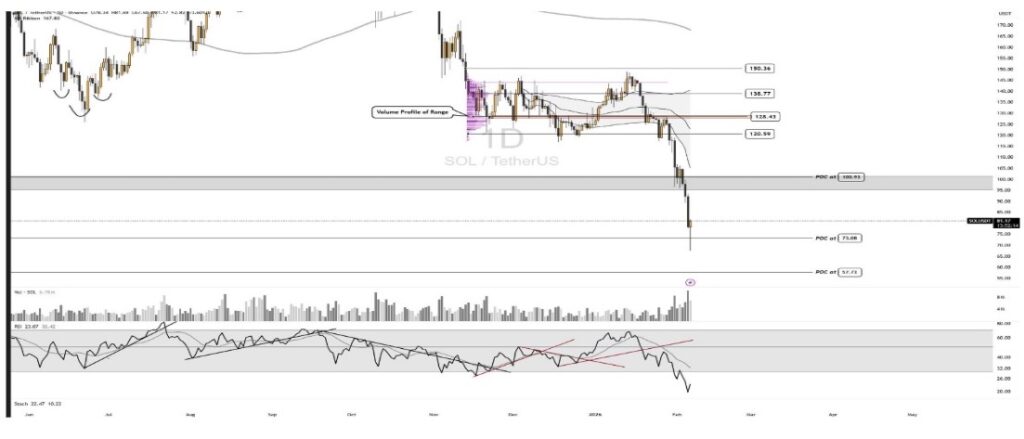
One of the most important technical signals is the disappearance of the USD100 area as a point of control. If converted, this level is around IDR1.69 million, which was previously a heavy transaction zone.
Losing this area accelerates the price drop. After the breakdown, Solana quickly moved towards a new balance area at lower levels.
3. USD67-73 Zone is a Temporary Holding Area
After a sharp drop, SOL entered an important volume area in the range of USD67-73. This range is equivalent to approximately IDR1.13 million to IDR1.23 million.
From this zone, Solana had bounced around 12%. However, this bounce was not strong enough to change the main trend which is still bearish.
4. Volume Rises as Price Falls is a Cautionary Signal
A rise in trading volume that occurs alongside a fall in price is a signal of caution. In crypto technical analysis, this condition often indicates that seller confidence is still dominant.
This reduces the chances of a quick V-shape recovery. Novice investors need to understand that a price bounce does not necessarily mean a trend reversal.
5. USD100.93 Level is Key to Recovery Start
To start building a bullish structure, Solana needs to break back out of the USD100.93 area. This level now acts as a major resistance.
Without successfully reclaiming the area, any price increase risks becoming just a temporary rally. The daily market structure needs to turn healthier before a sustainable uptrend is established.
6. Phased Price Target If Resistance Breached
If SOL manages to break USD100.93, the next upside targets are at USD120.59, USD128.43, and USD138.77. In rupiah, this range is equivalent to IDR2.03 million to IDR2.34 million.
The next psychological target is around USD150 or IDR2.53 million. This level is an important area to test the strength of the cryptocurrency’s recovery momentum.
7. Optimistic Scenario Towards USD200 Still Conditional
In the most optimistic scenario, Solana could potentially rise to the range of USD200-210. If converted, this target is around IDR3.37 million to IDR3.55 million.
However, this scenario is highly dependent on SOL successfully maintaining its bullish structure above USD150. Without a strong foundation, such a high target remains speculative.
A Neutral Picture for Crypto Investors
Technically, Solana is still in a bearish trend although chances of recovery remain. Crypto investors are advised to focus on key levels and price structure changes, not just short-term bounces.
For novice investors, phases like this emphasize the importance of risk management. Solana’s current movements reflect the general dynamics of the cryptocurrency market, which is still full of uncertainty.
Also Read: 5 AI Perspectives: Will XRP Fall Below $1 in February 2026?
Follow us on Google News to stay up to date with the latest crypto and blockchain technology. Check Bitcoin price, USDT to IDR and Nvidia stock price tokenized via Pintu Market.
Enjoy an easy and secure crypto trading experience by downloading the Pintu crypto app via Play Store or App Store now. Also, experience web trading with advanced trading tools such as pro charting, various order types, and portfolio tracker only at Pintu Pro.
*Disclaimer
This content aims to enrich readers’ information. Pintu collects this information from various relevant sources and is not influenced by outside parties. Note that an asset’s past performance does not determine its projected future performance. Crypto trading activities are subject to high risk and volatility, always do your own research and use cold hard cash before investing. All activities of buying and selling Bitcoin and other crypto asset investments are the responsibility of the reader.
Reference
- Scott Matherson / NewsBTC. Can Solana Price Still Reach A New ATH After Crashing To 2-Year Lows? Accessed February 9, 2026.