NVIDIA April 2026 Share Price Prediction: Ready for a Surge or Sharp Correction?

Jakarta, Pintu News – April 2026 is a very crucial month for NVIDIA (NASDAQ: NVDA)’s stock price movement. After rising 5.31% in the last few days to $177.64, the stock is still down 6% since the beginning of the year.
The geopolitical situation in the Middle East, the FOMC meeting at the end of April, as well as the build-up to earnings reports in May, are all decisive factors that can drastically change the direction of stock prices.
This article will dissect technical analysis, options data, and institutional fund flows to map out possible scenarios through April 2026!
Head and Shoulders Pattern and Lack of Institutional Support
The two-day chart shows that NVIDIA’s share price is currently in a head and shoulders pattern, with the highest peak at $197.72 reached on the last earnings day in February. Currently, the right shoulder part of the pattern is forming, and if the neckline is broken, a potential 15% drop could occur. The Chaikin Money Flow (CMF) indicator, which benchmarks institutional buying and selling pressure, remains at -0.08, signaling a lack of support from large investors.
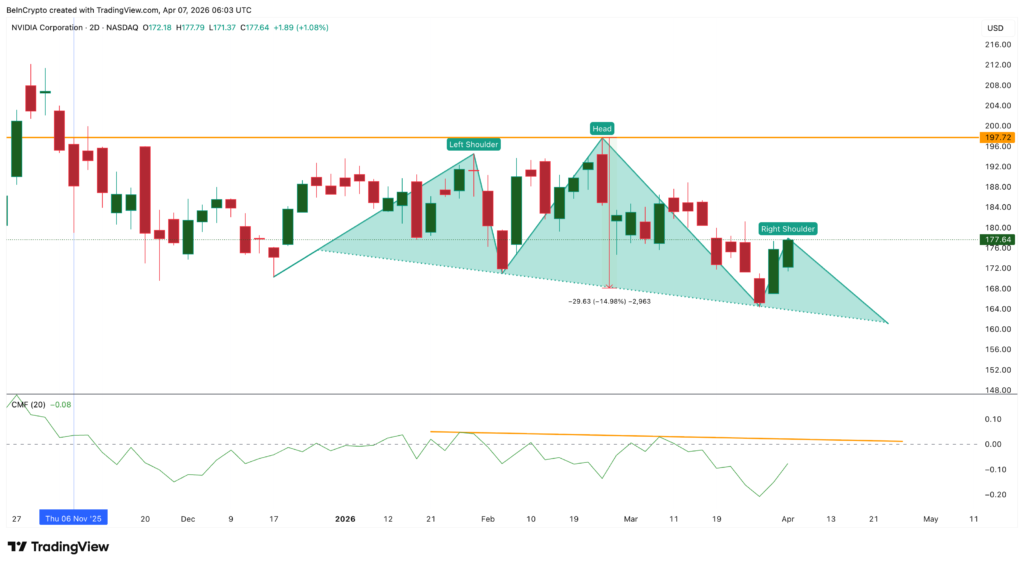
Since late March, the CMF has started to rise, but it has not been able to break the positive zone, so any price increase risks only forming a right shoulder and reinforcing the bearish pattern. This lack of institutional confidence has a lot to do with global macroeconomic conditions. Oil prices staying above $111 per barrel keep inflation expectations high, so the Fed tends to hold interest rates at high levels.
Long periods of high interest rates will pressure the valuations of growth stocks like NVIDIA. In addition, the strengthening US dollar also adds pressure on the company’s international earnings, so institutional fund flows are likely to refrain from entering the stock.
Also read: 3 Potential April 2026 Coin Memes
Options Trader Attitude Change
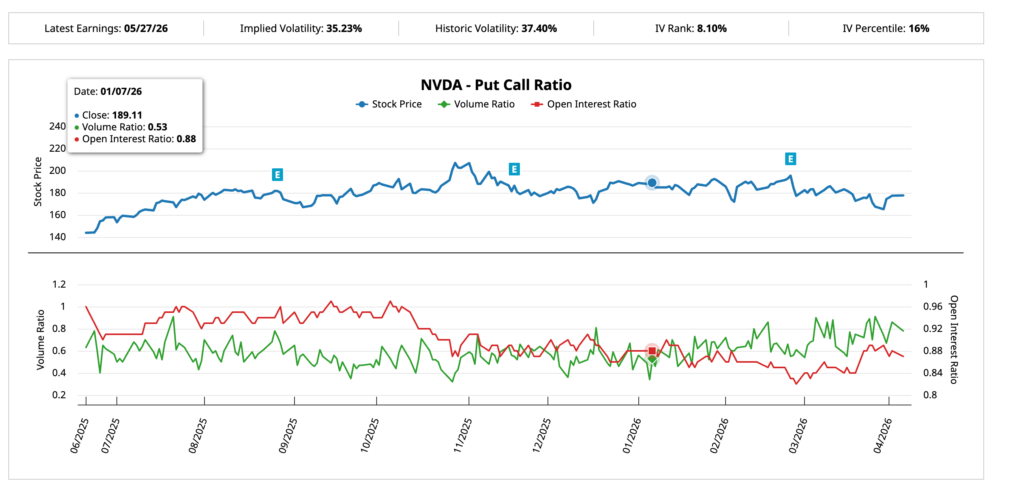
Barchart’s put-call ratio data shows a significant change compared to the period before the previous earnings report. On January 7, when NVIDIA’s share price was at $189.11 and about seven weeks before the February earnings report, the put-call volume ratio was at 0.53, signaling the dominance of bullish speculation.
However, on April 6, around the same time as the May earnings report, the ratio rose to 0.78, indicating call and put activity was getting more balanced. The open interest ratio remained stable at 0.87, indicating long positions still persist, but new bullish flows are slowing down and defensive positions are growing.
This rise in the put-call ratio does not necessarily signal a bearish market, but rather shows that the over-optimism that was once prevalent has now disappeared. Traders would rather hedge than speculate, in line with the negative signals from the CMF.
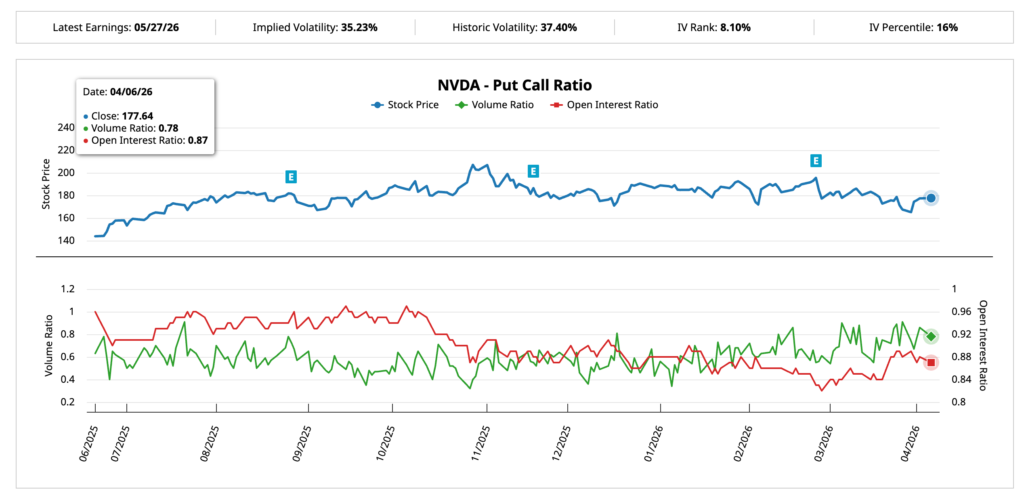
On the other hand, the Implied Volatility (IV) Percentile stands at only 16%, and the IV Rank at 8.10%, signaling very low volatility in the options market. This makes the market appear calm, but has the potential to trigger sharp price movements if there are fundamental surprises.
Read also: 5 Asset Manager Giants Dominating Crypto Wall Street in 2026
NVIDIA’s Key Price Level in April 2026
NVIDIA’s share price is currently at $177.64, very close to the important technical level of $177.03. If it is able to break the resistance level at $184.91 (Fibonacci zone 0.618), the potential for an increase to $190.53 is wide open. The $197.72 level is the upper limit which, if broken, will invalidate the bearish pattern and change the price structure to bullish.
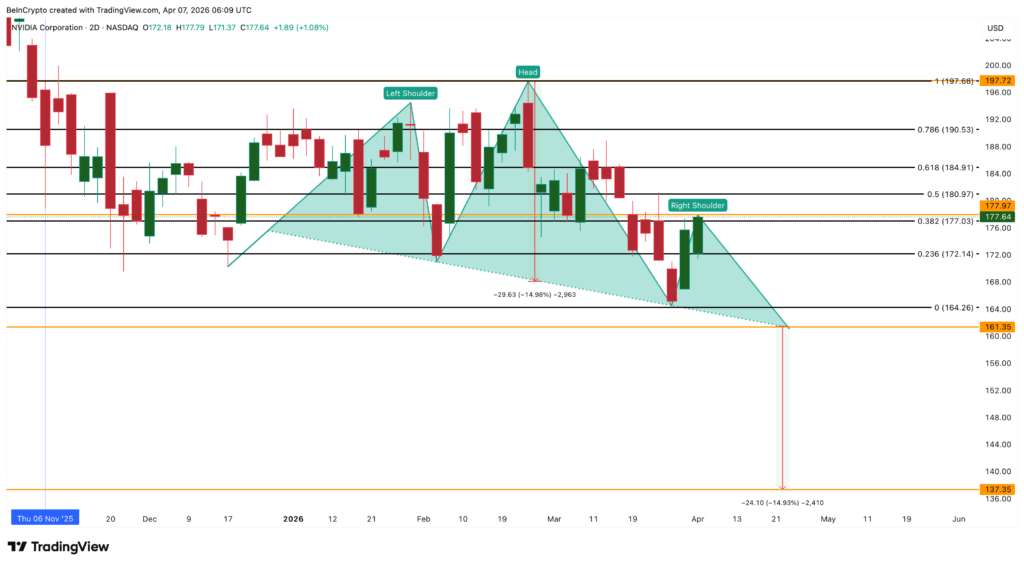
This scenario could happen if the Iran conflict subsides and oil prices fall, leading to higher expectations of Fed rate cuts and a boost in valuations of growth stocks such as NVIDIA. Conversely, if the price drops through $172.14 (0.236 Fibonacci zone), the right shoulder of the head and shoulders pattern is considered formed and the risk of a drop to $161.35 (neckline) increases.
If the neckline is broken, the 15% downside target to $137.35 becomes valid. This bearish scenario will get stronger if geopolitical conflicts drag on, oil prices remain high, and the Fed gives hawkish signals at its April 28-29 meeting. Under these conditions, the already defensive options market will become even more bearish, and institutional fund flows will remain reluctant.
Follow us on Google News to stay up to date with the latest in crypto and blockchain technology. Check Bitcoin price, usdt to idr and tokenized nvidia stock price via Pintu Market.
As a safe crypto app, Pintu provides a crypto trading experience to access crypto gold investment easily and conveniently. You can also see today ‘ s gold jewelry price and today ‘ s gold bullion price to support your investment activities and portfolio diversification as well as learn crypto through Pintu Academy.
Download the Pintu crypto app via Play Store or App Store now. Enjoy the web trading experience with various advanced trading tools such as pro charting, various types of order types, and portfolio tracker only at Pintu Pro.
*Disclaimer
This content aims to enrich readers’ information. Pintu collects this information from various relevant sources and is not influenced by outside parties. Note that an asset’s past performance does not determine its projected future performance. Crypto trading activities are subject to high risk and volatility, always do your own research and use cold hard cash before investing. All activities of buying and selling Bitcoin and other crypto asset investments are the responsibility of the reader.
Reference
- BeInCrypto. Nvidia Stock Price April 2026 Outlook. Accessed on April 11, 2026
- Featured Image: Markets


