Bitcoin (BTC) Faces Critical Resistance, Will a Price Spike Happen?

Jakarta, Pintu News – Bitcoin is again testing a critical resistance zone after rising above $116,200. Now, the cryptocurrency is in a consolidation phase and may experience bullish momentum if it manages to break the resistance at $116,850.
Bitcoin (BTC) Price Increase
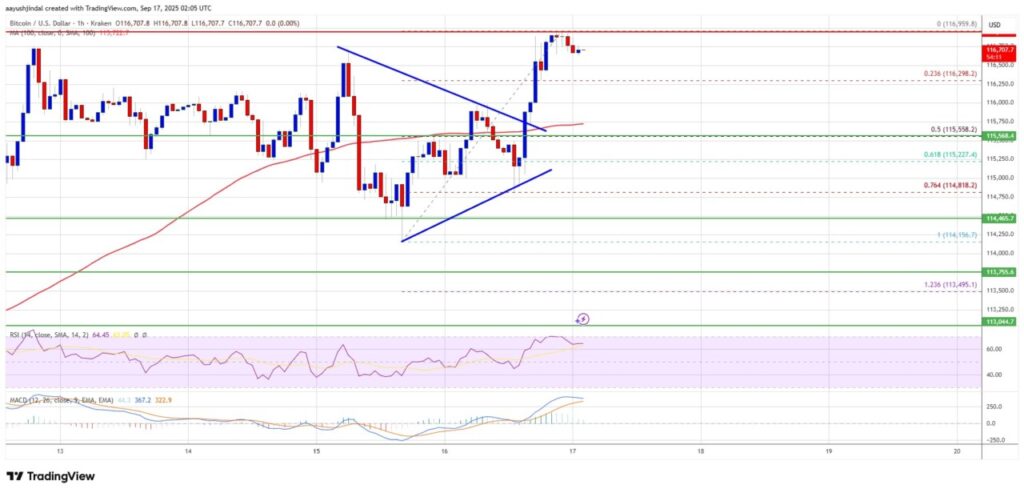
Bitcoin (BTC) started a new wave of gains by breaking out of the $114,500 zone. The gains took Bitcoin (BTC) past the $115,000 and $115,500 resistance levels. Market participants managed to push the price above $116,200 and $116,500. In addition, there was also a breakout of the triangle pattern contracting with resistance at $115,750 on the hourly chart of the BTC/USD pair.
The price touched a peak of $116,959 and is currently in a consolidation phase of gains. Bitcoin (BTC) is now trading above $116,000 and the 100 hourly simple moving average. Immediate resistance on the upside is near the $116,850 level, with the first key resistance near $117,200.
Also Read: Jake Claver, CEO of Digital Ascension Group’s Shocking Prediction: XRP Will Break $25!
Upside Potential and Next Resistance
If Bitcoin (BTC) manages to break the $116,850 resistance, the next resistance it may face is $117,500. A close above this resistance could push the price even higher. In that scenario, the price could try to break the $118,400 resistance level. A further rise might take the price towards $118,800. The next limit that the bulls will have to face is $119,250.
Possible Bitcoin (BTC) Price Drop
If Bitcoin (BTC) fails to break the $116,850 resistance zone, there is a possibility of a new price drop. Immediate support is near the $116,250 level. The first major support is near the $115,550 level or the 50% Fibonacci retracement level of the recent move from $114,156 to $116,959.
The next support is currently at the $115,200 zone. A further decline might take the price towards $114,500 support in the short term. The key support is at $112,500, below which Bitcoin (BTC) might experience a significant decline.
Technical Indicators
The Hourly MACD indicator is currently showing an increased speed in the bullish zone. Meanwhile, the hourly Relative Strength Index (Hourly RSI) for BTC/USD is now above the 50 level. The next major support level is $115,550, followed by $115,200. Meanwhile, the key resistance levels are $116,850 and $117,200.
Conclusion
With the upcoming Federal Reserve meeting, the market may witness significant price movements. Investors and market participants should monitor the aforementioned technical indicators and key levels to make the right investment decisions in these volatile market conditions.
Also Read: Maartunn Analyst Says December 2024 Crypto Market Pattern Repeats, What Does It Mean?
Follow us on Google News to get the latest information about the world of crypto and blockchain technology. Check today‘ s bitcoin price, today’s solana price, pepe coin and other crypto asset prices through Pintu Market.
Enjoy an easy and secure crypto trading experience by downloading Pintu crypto app via Google Play Store or App Store now. Also, get a web trading experience with various advanced trading tools such as pro charting, various types of order types, and portfolio tracker only at Pintu Pro.
*Disclaimer
This content aims to enrich readers’ information. Pintu collects this information from various relevant sources and is not influenced by outside parties. Note that an asset’s past performance does not determine its projected future performance. Crypto trading activities are subject to high risk and volatility, always do your own research and use cold hard cash before investing. All activities of buying andselling Bitcoin and other crypto asset investments are the responsibility of the reader.
Reference
- NewsBTC. Bitcoin Price Back at Resistance. Accessed on September 18, 2025