Solana’s Hidden Bullish Signal Returns — Could It Be on the Verge of a New Record High?
Jakarta, Pintu News – Solana continues to show impressive performance in the crypto market. As of October 9, while the general market was only up 0.5%, Solana’s price had increased by almost 3%. This upward trend has been ongoing for the past three months, with a gain of around 37% in that period.
However, what is more interesting is not this short-term move, but rather the technical and on-chain indications that have recently emerged, suggesting that Solana may not only be gearing up for another rally, but could potentially break its previous record high of almost $293.
Hidden signals show SOL uptrend is not over yet
On Solana’s daily chart, a hidden bullish divergence pattern appears – a condition where the price forms a higher low while the Relative Strength Index (RSI) indicator registers a lower low. Traders usually use the RSI to gauge the strength of momentum and assess whether the price movement has the potential to continue or start weakening.
Read also: 3 Key Factors that Could Push Solana (SOL) Price to the $300 Level
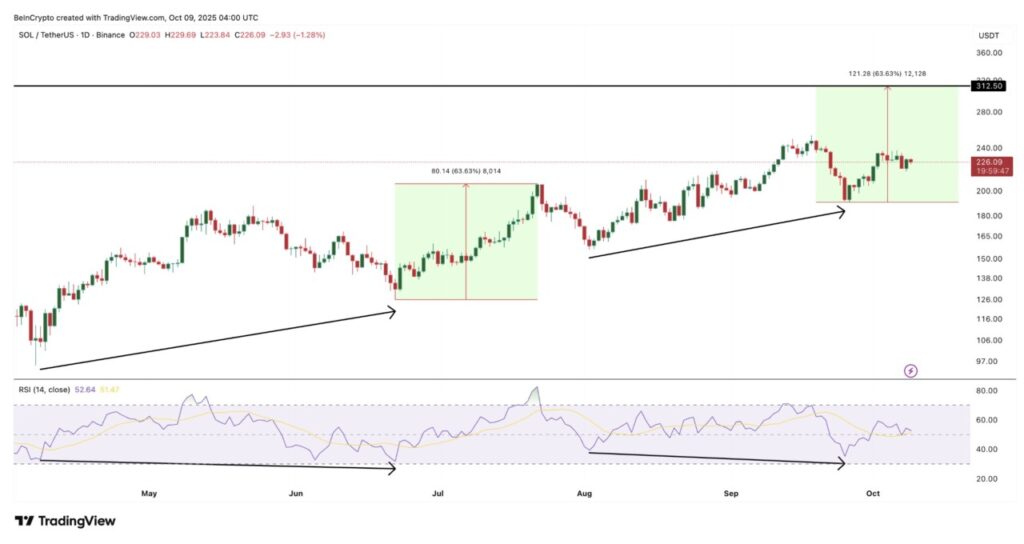
This pattern often signals that the uptrend still has steam and is not about to reverse. The last time a similar pattern appeared on Solana – between April 7 and June 22 – prices rose by 63.63% in just over a month. A similar pattern was seen again between August 2 and September 25, and about 24% of the potential upside was realized.
If Solana follows the previous movement pattern, the price could potentially reach $312 by the end of October, mimicking the scale and timing of previous rallies.
On-chain data further reinforces this view. The NUPL (Net Unrealized Profit/Loss) indicator for short-term holders – which measures whether new buyers are in a profit or loss position – currently stands at 0.11. This figure usually signals restrained profit-taking, rather than excessive euphoria.
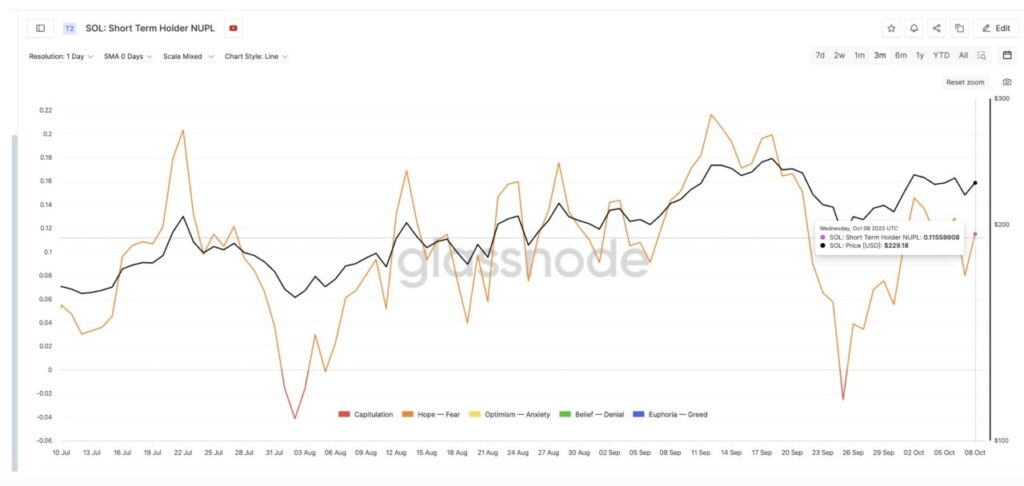
In previous cycles, NUPL values in the 0.20-0.21 range marked local price peaks – as happened in July and September – when short-term holders started selling aggressively.
While the current level around 0.10-0.11 is closer to thesteady zone as in August, when Solana actually strengthened after a mild correction.
Under these conditions, it is unlikely that the market is at a big top. Instead, there is still room for the price to go higher, reinforcing the bullish divergence signal seen on the chart.
Solana Price Setup Shows Opportunity to Test Higher Levels
As of October 9, Solana was trading near $226, facing immediate resistance at $251, which is in line with the 0.618 Fibonacci extension – a level often considered a pivot point during sustained uptrends.
Also read: Despite ETF Hype, Whale Crypto Sells 440 Million XRP in a Month!
A clean close above this mark could push SOL towards $288, followed by a retest of the $293 record high, an important psychological level for traders. If Solana prices manage to break above that, the previous fractal projects a move towards $312 and even $349, as a potential new milestone.
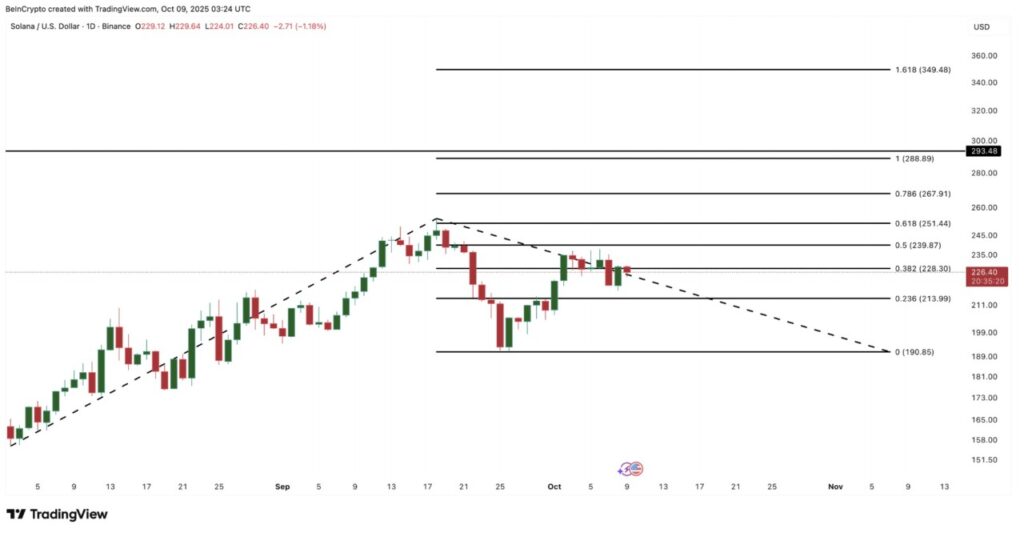
However, if the price drops below $213 and then $190, the thesis of bullish continuation weakens, signaling a possible short-term pullback or even a deeper correction.
Overall, with hidden bullish signals and support from technical data and on-chain, Solana (SOL) shows potential that is not just limited to short-term upside.
The readiness to test and even surpass previous record highs indicates significant strength in this crypto asset. Investors and traders would be wise to take note of these dynamics when assessing their positions within the broader crypto market.
That’s the latest information about crypto. Follow us on Google News to get the latest crypto news about crypto projects and blockchain technology. Also, learn crypto from scratch with complete discussion through Pintu Academy and stay up-to-date with the latest crypto market such as bitcoin price today, xrp coin price today, dogecoin and other crypto asset prices through Pintu Market.
Enjoy an easy and secure crypto trading experience by downloading Pintu crypto app via Google Play Store or App Store now. Also, get a web trading experience with various advanced trading tools such as pro charting, various types of order types, and portfolio tracker only at Pintu Pro.
*Disclaimer
This content aims to enrich readers’ information. Pintu collects this information from various relevant sources and is not influenced by outside parties. Note that an asset’s past performance does not determine its projected future performance. Crypto trading activities have high risk and volatility, always do your own research and use cold cash before investing. All activities of buying and selling bitcoin and other crypto asset investments are the responsibility of the reader.
Reference:
- BeInCrypto. Solana Price: Hidden Bullish Signal Points to $312 Target. Accessed on October 10, 2025