Solana Price Edges Toward Breakout — Could a 20% Surge Mark the Turning Point?
Jakarta, Pintu News – Solana price has had a pretty rough few weeks. Every attempt to break the resistance level always ends up with a short bounce.
In the last seven days, the token is down about 10%, yet it still recorded a small gain of about 2% in the last three months, which suggests its long-term uptrend is still holding.
Now, another potential bounce is on the horizon – and this time, both on-chain data and chart analysis suggest that this move could develop into something stronger, provided Solana prices manage to break through a key resistance level.
Short-Term Buyers Step In as Long-Term Pressure Eases
Blockchain data from HODL Waves shows that short-term holders are starting to return to accumulation. This metric tracks the percentage of total token supply held by groups of holders based on the length of time they hold the asset.
Read also: 2 Crypto to Watch Ahead of October US CPI Report 2025
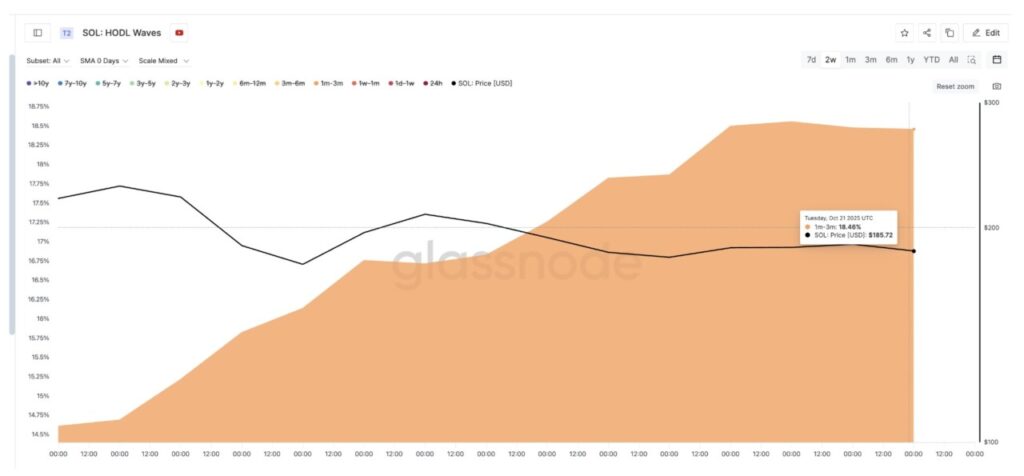
In the past two weeks, wallets holding SOL for one to three months saw an increase in the proportion of holdings, from 14.61% on October 7 to 18.46% on October 21 – a rise of about 26%. This indicates a clear accumulation near the recent low price point.
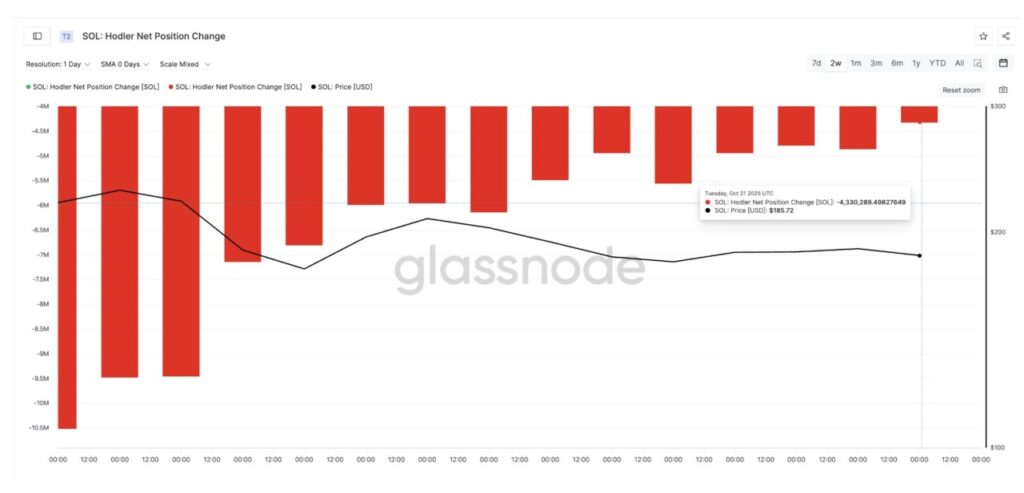
Meanwhile, long-term holders are still selling, but at a slower pace. The Hodler Net Position Change metric – which measures how much long-term investors are adding or subtracting from their holdings – is still in negative territory.
This means that coins are still coming out of old wallets. However, the outflow decreased sharply by about 59%, from -10.52 million SOL on October 7 to -4.33 million SOL on October 21.
This change suggests that short-term buyers are now absorbing most of the selling from long-term holders. The slowing selling pressure, coupled with buyingthe dip, reinforces the possibility of a stronger price bounce. If the resistance level is successfully broken, this could develop into a breakout.
However, Solana’s price bounce scenario could get a bigger boost ifnet-selling flows turn intonet-buying.
Solana’s price structure indicates breakout opportunities are on the horizon
On the daily chart (22/10), Solana’s price movement is still in a falling wedge pattern, a formation that generally ends with an upward movement.
Read also: Pi Network’s Big Ambitions: Ready to Become a Major Blockchain Ecosystem in 2025?
The Relative Strength Index (RSI) indicator, which measures the speed and strength of price movements, showed a bullish divergence – where the RSI was registering higher lows, while prices were printing lower lows between September 25 and October 21.
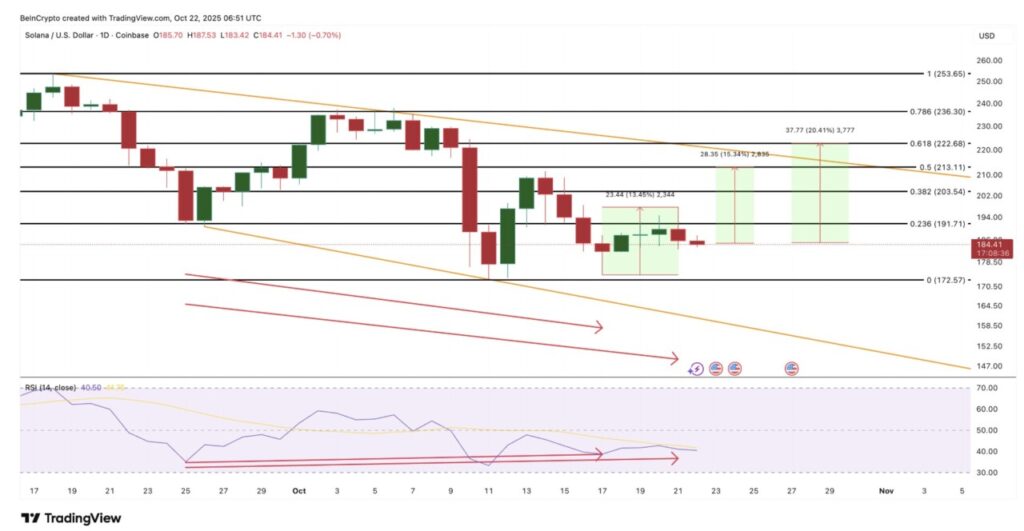
This pattern usually leads to a trend reversal, but so far the SOL price has only been able to record small bounces.
The bullish divergence suggests that momentum is picking up although the price is yet to show a significant reaction – a signal that the pressure from sellers is weakening. A similar pattern that occurred between September 25 and October 17 triggered a bounce of 13.4%, pushing Solana’s price from $174 to $197.
If this pattern repeats, a 15% increase from the current level around $184 could take Solana prices to $213 and break the lower-high pattern. A further move of 20% towards $222 would confirm the breakout of the wedge, and could extend the rally towards the $236-$253 range.
However, if Solana drops below $172, this bullish structure will be broken and could trigger a deeper drop. Given that the lower trendline of this wedge is only formed from two touch points, this level is likely to be weaker. Therefore, a drop below $172 is something optimistic Solana traders should be wary of.
For now, the improved momentum and reduced selling pressure suggest that the price bounce this time may be quite strong – potentially even starting a Solana price rally.
That’s the latest information about crypto. Follow us on Google News to get the latest crypto news about crypto projects and blockchain technology. Also, learn crypto from scratch with complete discussion through Pintu Academy and stay up-to-date with the latest crypto market such as bitcoin price today, xrp coin price today, dogecoin and other crypto asset prices through Pintu Market.
Enjoy an easy and secure crypto trading experience by downloading Pintu crypto app via Google Play Store or App Store now. Also, get a web trading experience with various advanced trading tools such as pro charting, various types of order types, and portfolio tracker only at Pintu Pro.
*Disclaimer
This content aims to enrich readers’ information. Pintu collects this information from various relevant sources and is not influenced by outside parties. Note that an asset’s past performance does not determine its projected future performance. Crypto trading activities have high risk and volatility, always do your own research and use cold cash before investing. All activities of buying and selling bitcoin and other crypto asset investments are the responsibility of the reader.
Reference:
- BeInCrypto. Solana Price Needs 20% Bounce to Rally. Accessed on October 23, 2025