Shiba Inu Price Prediction: Fails to Break Triangle Pattern, Key Liquidity Zones in the Spotlight!
Jakarta, Pintu News – As of November 5, the price of Shiba Inu is trading around $0.00000905, breaking downwards from the consolidation zone of the past few weeks. This decline comes after the price was rejected at the downtrend line, signaling sellers’ dominance in the short term.
This weakness puts additional pressure on the buyers’ side and opens up the potential for further downside towards the liquidity area around $0.0000080 as the next major target on the downside.
Spot Outflows Increase, Buyers Start to Pull Away
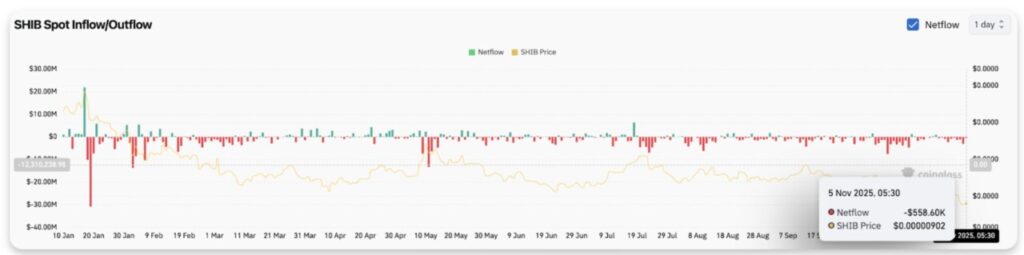
Data from Coinglass shows an outflow of $3.06 million yesterday, followed by an additional $558,600 today. This indicates an active distribution by SHIB holders.
Read also: Dogecoin Price Up 2% Today: DOGE Chart Shows Short-Term Weakness?
The row of red netflow bars throughout October and November reflects that owners prefer to move their tokens to exchanges-not withdraw them to cold storage.
Whennetflows remain negative for several consecutive sessions, it signals liquidity leaving the ecosystem, and prices usually continue to experience downward pressure.
In the case of SHIB, the selling pressure is in line with the technical decline. There is no sign of spot accumulation, and buyers are yet to make a move to defend this weakening price structure.
EMA Becomes Resistance, Confirming Strength of Downtrend

The Shiba Inu is now losing support from the triangle pattern that previously held for almost two weeks. The price rejection occurred right at the downtrend line drawn from the August peak, confirming that the medium-term downtrend still prevails.
SHIB prices are now below allexponential moving averages (EMA) indicators, namely:
- 20-day EMA: $0.00001062
- 50-day EMA: $0.00001163
- 100-day EMA: $0.00001252
- 200-day EMA: $0.00001271
All EMAs are arrayed downwards and above the current price, forming a multilevel resistance level like a “ceiling”. Any attempt to break back through the 20-day EMA so far has been immediately answered with aggressive selling, indicating weak buying strength even for the relief of a short-term rally.
The Supertrend indicator is still firmly in the red. As long as SHIB has not been able to close above the Supertrend band, the trend direction cannot be considered neutral – let alone bullish.
Key Support Levels to Focus
SHIB’s current price action highlights the importance of the support zone in the $0.0000088 to $0.0000080 range – an area that was previously a demand zone back in July. If this level is broken downwards, it opens up the potential for a deeper drop towards June’s low.
Below $0.0000080, the next liquidity zone is only seen around $0.0000072. This forms a fairly clear sequence of decline:
- Below $0.0000090, bearish pressure remains dominant
- Losing $0.0000080 confirms deeper correction
- Next major target: $0.0000072
Read also: Franklin Templeton Ready to Launch ETF XRP This Month After Latest S-1 Filing!
Short-Term Chart Shows Stabilization Efforts
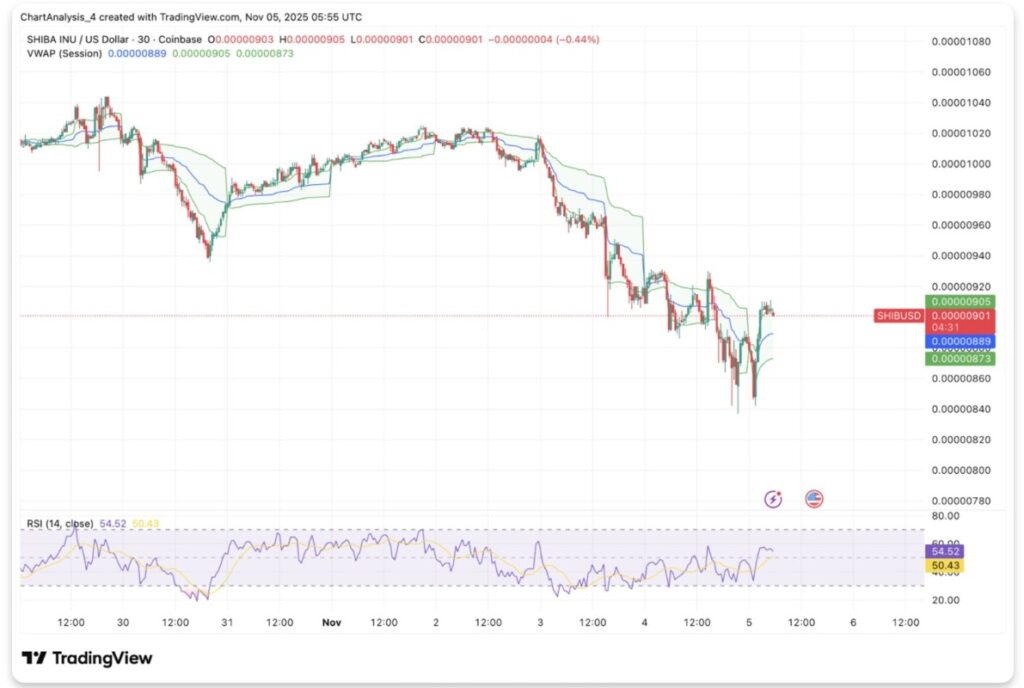
In the smaller time frame, there was an attempt by buyers to slow down the decline. On the 30-minute chart, SHIB briefly reclaimed the VWAP band after experiencing oversold conditions. The RSI indicator also rose above 50, hinting at intraday price stabilization after the breakdown.
However, this recovery cannot be considered valid until the price closes above $0.00000930, which is the intraday supply zone in line with the session’s VWAP. Until that point is broken, any bounce is just a temporary bounce inside a larger downtrend.
Outlook: Will Shiba Inu Rise?
The direction of further movement will be largely determined by the price reaction to the $0.0000088 – $0.0000080 support zone.
Bullish Scenario: If SHIB bounces off $0.0000088 and manages to close above $0.00001062 with volume support, then this will pave the way to break the initial resistance and head towards the upper trendline around $0.00001200.
Bearish Scenario: In the event of a daily close below $0.0000080, the decline will be confirmed to continue towards the next target at $0.0000072, in line with the medium-term downtrend.
Overall, trend recovery will only occur if the price is able to break $0.00001062 and exit the Supertrend red zone. Conversely, losing $0.0000080 will deepen the correction towards $0.0000072.
That’s the latest information about crypto. Follow us on Google News to get the latest crypto news about crypto projects and blockchain technology. Also, learn crypto from scratch with complete discussion through Pintu Academy and stay up-to-date with the latest crypto market such as bitcoin price today, xrp coin price today, dogecoin and other crypto asset prices through Pintu Market.
Enjoy an easy and secure crypto trading experience by downloading Pintu crypto app through Google Play Store or App Store now. Also, get a web trading experience with various advanced trading tools such as pro charting, various types of order types, and portfolio tracker only at Pintu Pro.
*Disclaimer
This content aims to enrich readers’ information. Pintu collects this information from various relevant sources and is not influenced by outside parties. Note that an asset’s past performance does not determine its projected future performance. Crypto trading activities have high risk and volatility, always do your own research and use cold cash before investing. All activities of buying and selling bitcoin and other crypto asset investments are the responsibility of the reader.
Reference:
- CoinEdition. Shiba Inu Price Prediction: Triangle Failure Puts Key Liquidity Zone in Focus. Accessed on November 6, 2025


