Ethereum Crashes to $1,900 — Is a Bearish Trend Taking Over ETH?

Jakarta, Pintu News – Ethereum continues to face technical pressure as the short-term price structure weakens and general market confidence remains fragile. In the 4-hour chart (5/2), ETH shows a clear downward trend, characterized by a pattern of lower peaks and lower bottoms.
The recent recovery attempt towards the $2,125 area failed to change the structure, reinforcing the view that the move was not accompanied by strong conviction. Therefore, traders remain cautious as the price remains below the crucial resistance zone.
Then, how will Ethereum price move today?
Ethereum Price Drops 9.47% in 24 Hours
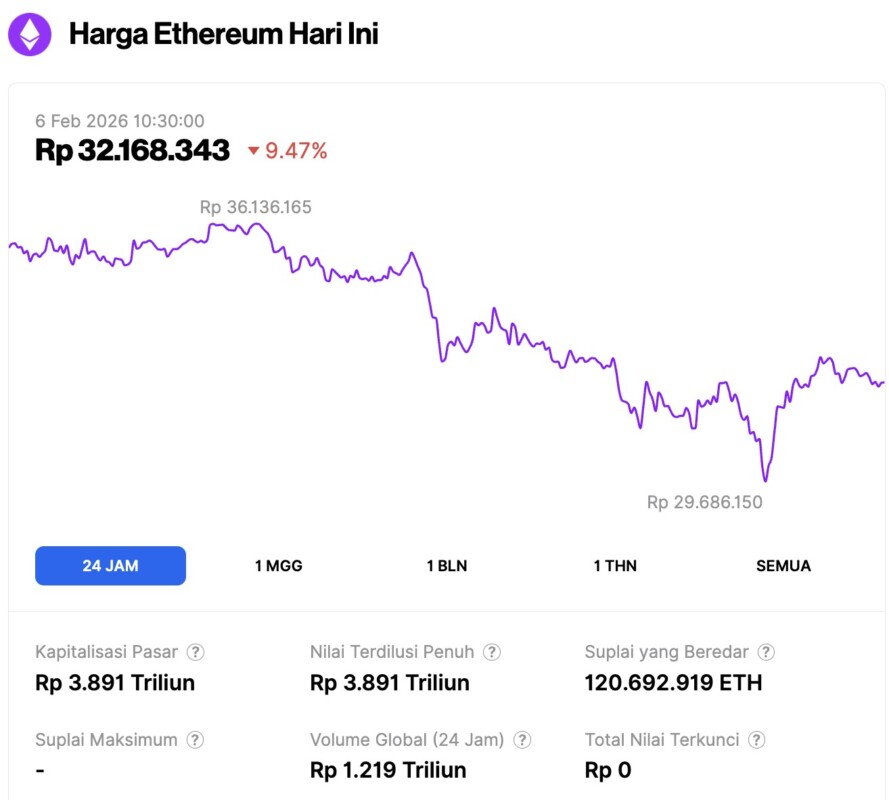
On February 6, 2026, Ethereum was trading at approximately $1,902, or about IDR 32,168,343 — marking a 9.47% drop over the past 24 hours. During this time, ETH hit a low of IDR 29,686,150 and a high of IDR 36,136,165.
At the time of writing, Ethereum’s market capitalization is around IDR 3,891 trillion, while its daily trading volume has surged 51% to IDR 1,219 trillion over the last 24 hours.
Read also: Bitcoin Plunges to $64,000 — Is a Drop to $55,000 Coming Next?
Bearish Structure Dominates the 4-Hour Chart
Ethereum is trading below all major exponential moving averages (EMAs), including the 20, 50, 100, and 200 EMAs. All of these levels are now showing a downward slope and limiting any attempts at price gains. Moreover, the trend indicators are still in favor of sellers, suggesting limited momentum from buyers.
The broader decline accelerated after ETH lost key Fibonacci levels, with selling pressure increasing with each breakdown. As a result, the price is now moving near the crucial demand zone between $2,063 and $2,080.
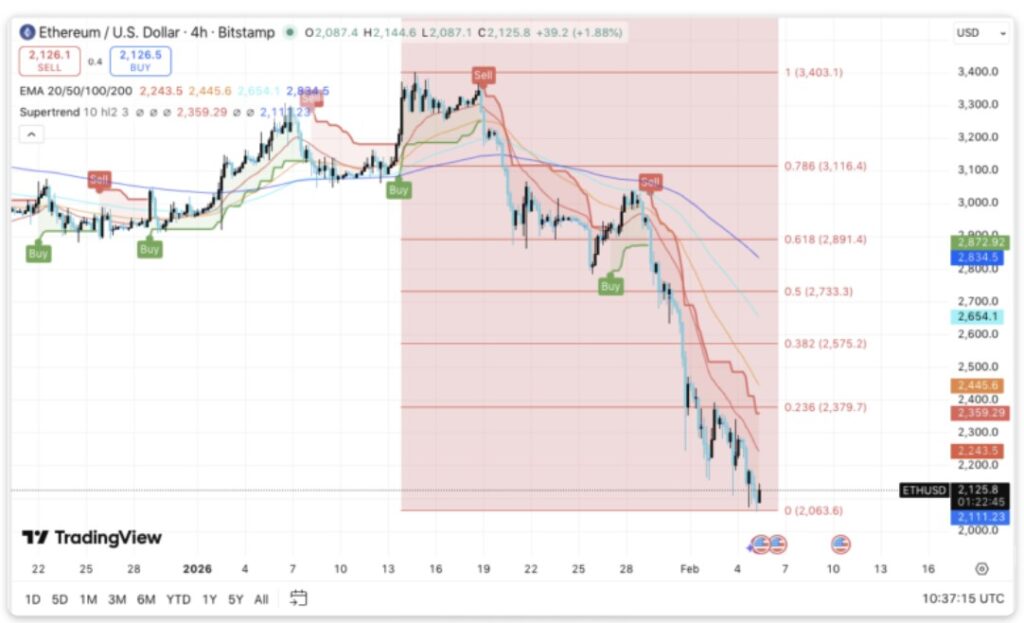
This area is the last visible short-term support. If the price breaks clearly below this range, then the $2,000 psychological level could be threatened. Besides being psychologically important, the zone also often triggers high volatility.
If sellers manage to push the price down further, liquidity on the downside between $1,920 and $1,880 could potentially be accessed. On the upside, ETH needs to reclaim the $2,245 to $2,260 region before the recovery could gain a strong foothold.
Derivatives and Spot Market Data Show Signs of Market Reset
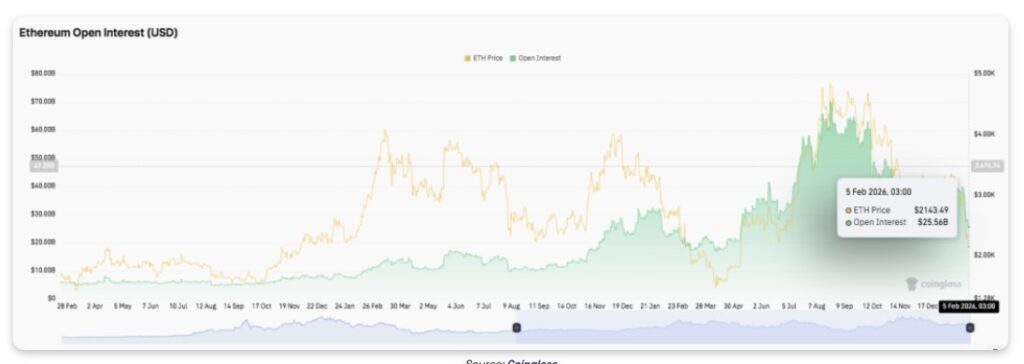
The Ethereum derivatives market reflects a broader reset in speculative positioning. Open interest had risen sharply during the previous rally, even breaching the $60 billion mark as leverage usage surged.
However, each such rise ended with a sharp contraction, signaling forced liquidation during the correction. Recently, open interest fell to the mid-$20 billion range, indicating a broad deleveraging process. This decline helped to dampen short-term volatility while purging excessive risk from the system.
Spot flow data adds further context. Ethereum experienced sustained net outflows over a long period of time, indicating an ongoing distribution process. There was a spike in inflows during a brief price bounce phase, but no strong continuation.
Read also: Crypto Market Continues to Plummet, Will 2026 be the Worst Year?
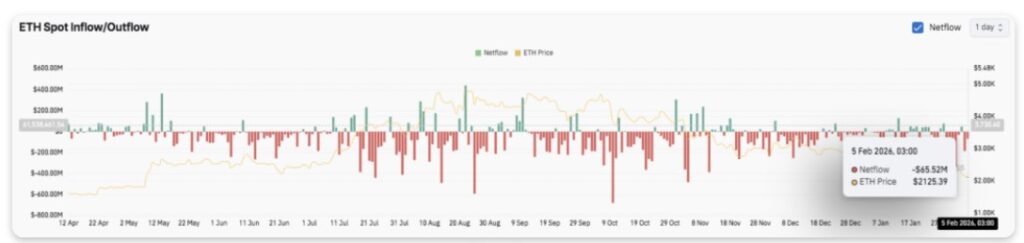
Most strikingly, the latest flow shows contraction on both sides – both buying and selling – indicating uncertainty and weak demand in the spot market. Currently, the market seems to be waiting for clearer accumulation signals before taking the next direction.
Innovation Debate Adds to Long-term Uncertainty
Beyond price movements, strategic concerns are now also being discussed. Ethereum co-founder Vitalik Buterin recently challenged developers to revisit current development trends.
He warns that repeated application of similar EVM chains and scaling designs can slow down truly meaningful progress. Instead, he encouraged exploration of new execution models, privacy systems, and low-latency architectures.
Ethereum Price Technical Overview
Key levels for Ethereum remain evident, with price currently in an important inflection zone ahead of the next trading session.
On the upside, the $2,245-$2,260 area is the first resistance cluster. If the price manages to break out of this range, there is a potential path open towards $2,360-$2,380, and then proceed to $2,445-$2,460 – an area where a lot of resistance from EMAs converge.
A sustained recovery above $2,575 (0.382 Fibonacci level) is required to indicate a broader trend change and restore medium-term bullish momentum.
On the downside, immediate support lies in the $2,063-$2,080 range, which previously acted as a short-term demand zone. If this area fails to hold, the risk of a decline towards the $2,000 psychological level will increase.
Below $2,000, the next pocket of liquidity is between $1,920 and $1,880 – where buyers may try to stabilize the price.
Technically, the current price structure suggests that Ethereum is still in bearish control, with prices consolidating below major moving averages. This compression pattern hints at a potential volatility expansion in the near future.
Follow us on Google News to stay up to date with the latest in crypto and blockchain technology. Check Bitcoin price, usdt to idr and tokenized nvidia stock price through Pintu Market.
Enjoy an easy and secure crypto trading experience by downloading the Pintu crypto app via Play Store or App Store now. Also, experience web trading with advanced trading tools such as pro charting, various order types, and portfolio tracker only at Pintu Pro.
*Disclaimer
This content aims to enrich readers’ information. Pintu collects this information from various relevant sources and is not influenced by outside parties. Note that an asset’s past performance does not determine its projected future performance. Crypto trading activities are subject to high risk and volatility, always do your own research and use cold hard cash before investing. All activities of buying and selling Bitcoin and other crypto asset investments are the responsibility of the reader.
Reference:
- CoinEdition. Ethereum Price Prediction: ETH Downtrend Persists While Developers Face Calls for Real Innovation. Accessed on February 6, 2026