Bitcoin Surges to $70,000 Amid Surge in Relative Unrealized Loss Metrics

Jakarta, Pintu News – The latest Bitcoin price drop has left more and more holders at a loss on paper. At the same time, another cost basis indicator points to a potential price drop to the mid-$30,000 range if previous cyclical patterns repeat themselves.
Overall, the charts portray this correction as a test of investor confidence, with unrealized losses rising and long-term holding levels back in the spotlight. So, how will Bitcoin price move today?
Bitcoin price rises 2.41% in 24 hours
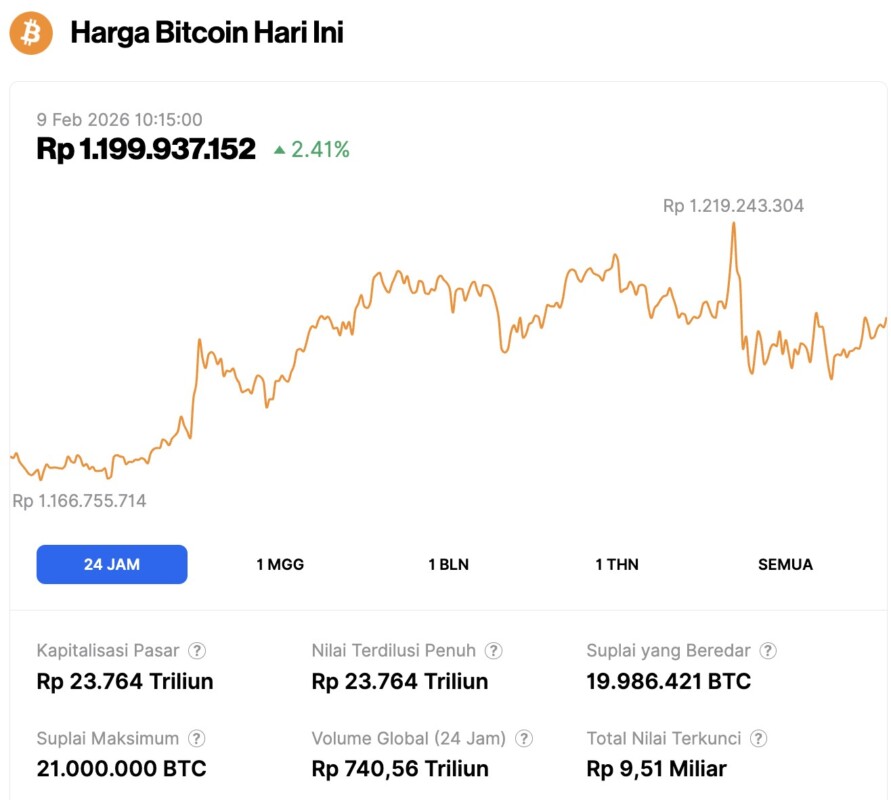
On February 9, 2026, Bitcoin was trading at $70,837, or about IDR 1,199,937,152, marking a 2.41% gain over the past 24 hours. During that period, BTC dipped to a low of around IDR 1,166,755,714 and climbed to an intraday high near IDR 1,219,243,304.
At the time of writing, Bitcoin’s market capitalization is roughly IDR 23,764 trillion, while its 24-hour trading volume has declined by 29% to about IDR 740.56 trillion.
Read also: Bitcoin Price Prediction 2026: Is it the Right Time to Invest?
BTC’s Relative Unrealized Loss Surges to Highest Levels
Bitcoin’s relative unrealized loss rose to one of the highest levels in this cycle as the price corrected from its latest peak, according to Glassnode data.
This indicator measures the portion of coins that are currently held at a loss on paper, and its value jumped sharply when the latest selloff occurred. This suggests that a growing supply of coins are in the “red” zone as spot prices drop from upper ranges to lower levels.
At the same time, the price of Bitcoin in dollars remains well below recent peaks, so this decline is pushing more short-term holders into losing positions.
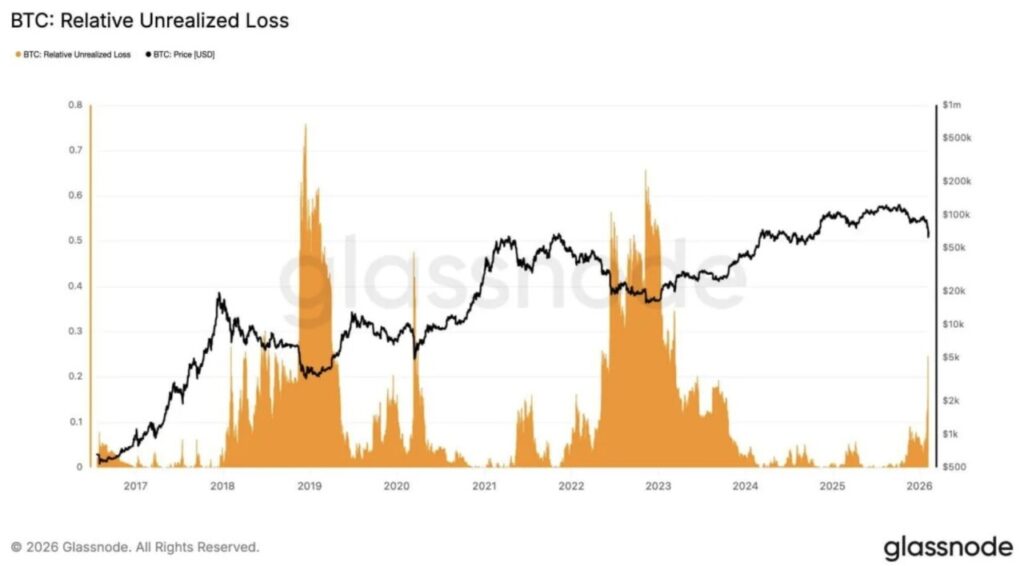
The chart shows that previous spikes in relative unrealized loss coincided with the big down phase in 2018-2019 and again in the bear market phase of 2022. In each of these periods, the orange loss bands widened as prices fell, and then narrowed again as prices stabilized and turned upwards.
This time, the loss portion widened again as Bitcoin reversed down from the high of the late-cycle phase, while the price remained stuck below the previous resistance area. As a result, the latest readings place the market conditions now closer to the historical pressure zone than the phase when the majority of the market was in profit.
Even so, the indicator rarely stays at high levels for long outside of major downturns. In previous spikes, the downside pressure usually subsided when the selling pressure weakened and the price found areas of support. Currently, the data shows that the losses increased during the correction, while the price moved down compared to its new range.
As such, the current market structure depicts renewed pressure among coin holders following a price drop, with the indicator widening in the weakening phase and narrowing when the price bounces-a pattern that has followed the downward phase of the cycle in previous periods.
Read also: 3 Altcoins that Crypto Whales Bought in Early February 2026 After Market Correction
Analysts Relate BTC Decline Target to Long-Term Holder Realization Price
Bitcoin could form a bottom around $34,500 if its price falls about 15% below the long term holder realized price, according to crypto trader TedPillows, who shared a chart from Bitcoin Magazine Pro that tracks that metric against the spot price of BTC.
TedPillows explains that in each cycle, the bottom is approximately 15% below the long term holder realized price – a cost basis-like metric that reflects the average purchase price of coins held over a longer period of time.
In the latest reading of the chart, the long term holder realized price is around $40,300, while the spot price of Bitcoin is still above that level after a correction from its recent peak. Based on the 15% spread he uses, TedPillows forecasts a potential bottom near $34,500 if the historical pattern repeats itself.
However, TedPillows added that he personally doesn’t expect Bitcoin to drop that deep, although he did highlight the connection to the previous cycle depicted by the boxed area on the chart, where the spot price briefly dropped slightly below the long term holder realized price before reversing upwards.
Follow us on Google News to stay up to date with the latest in crypto and blockchain technology. Check Bitcoin price, usdt to idr and tokenized nvidia stock price via Pintu Market.
Enjoy an easy and secure crypto trading experience by downloading the Pintu crypto app via Play Store or App Store now. Also, experience web trading with advanced trading tools such as pro charting, various types of order types, and portfolio tracker only at Pintu Pro.
*Disclaimer
This content aims to enrich readers’ information. Pintu collects this information from various relevant sources and is not influenced by outside parties. Note that an asset’s past performance does not determine its projected future performance. Crypto trading activities are subject to high risk and volatility, always do your own research and use cold hard cash before investing. All activities of buying and selling Bitcoin and other crypto asset investments are the responsibility of the reader.
Reference:
- Coinpaper. Bitcoin Price Prediction: Is a 15% Drop Coming? Long-Term Holder Metric Says Watch $34.5K. Accessed on February 9, 2026


