Ethereum Price Hits $2,000 as ETH Remains Trapped in Key Resistance Zone

Jakarta, Pintu News – Ethereum briefly resumed its decline, as seen on the weekly chart which highlights a lower support area and a new Fibonacci resistance level above it. Meanwhile, the four-hour chart shows that the rebound attempt was stifled at the newly recaptured resistance zone, so the short-term downtrend still persists.
Ethereum Price Up 0.52% in 24 Hours
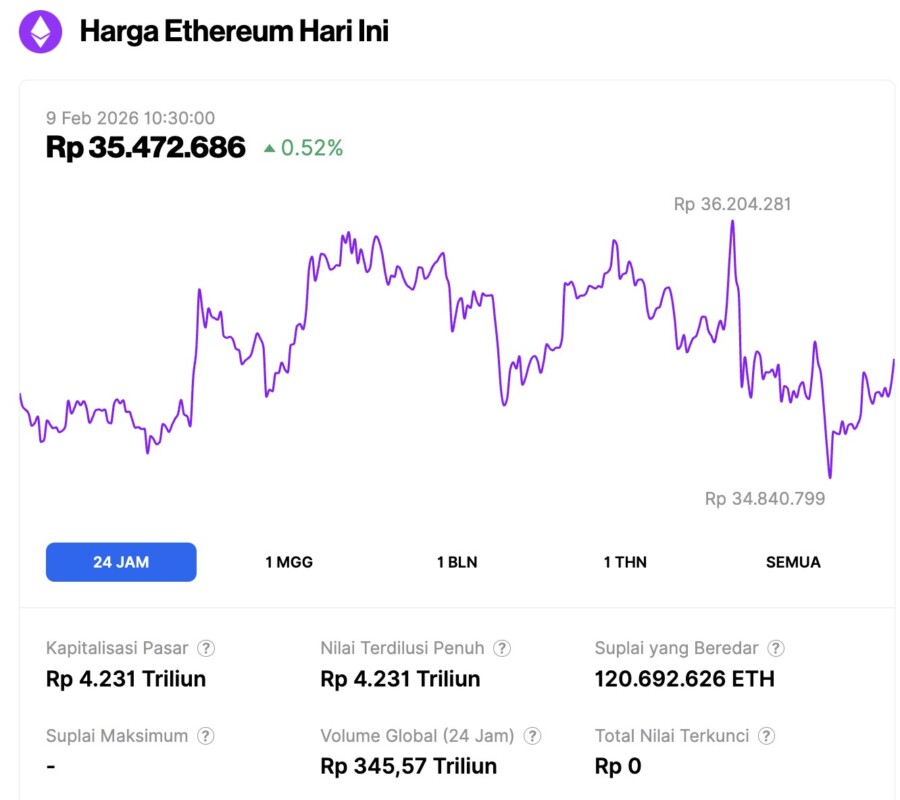
On February 9, 2026, Ethereum was trading at around $2,090, or roughly IDR 35,472,686, marking a modest gain of 0.52% over the previous 24 hours. Within that timeframe, ETH slipped to a low near IDR 34,840,799 and climbed as high as IDR 36,204,281.
At the time of writing, Ethereum’s market capitalization is estimated at about IDR 4,231 trillion, while its daily trading volume has dropped 46% over the last 24 hours to around IDR 345.57 trillion.
Read also: Bitcoin Surges to $70,000 Amid Surge in Relative Unrealized Loss Metrics
ETH Drops to Around $2,020 as Crypto Rover Marks “Buy Zone” Levels
Ethereum recorded a sharp decline on the weekly chart that Crypto Rover shared. Its weekly candlestick closed at around $2,021 after previously moving between approximately $2,391 and $1,739.
The snapshot shows a weekly decline of around 10.8% and shows the price starting to enter the brown support area just below the $2,000 zone.
On the upside, the chart also charts the Fibonacci levels above the current price. The 0.65 level is marked around $2,633 and the 0.618 level near $2,748 as resistance areas, while the 0.382 level is higher around $3,591. Further up, a reference line around $4,956 and another level around $5,557 are shown.
Below the current price, the chart highlights deeper support around $1,383 and a widening brown demand zone in the low $1,000s. In his post on X, Crypto Rover called ETH “not yet in the most ideal buy zone” and emphasized that patience is important while the price slowly moves closer to the marked lower area.
Read also: 3 Altcoins at Risk of Major Liquidation This Week
ETH Stuck in Resistance Zone
Ethereum’s four-hour chart shows continued selling pressure after the sharp decline, with the price failing to break back through the previous support area which has now turned into resistance.
The snapshot from TradingView marks multiple rejections in the boxed zone in the lower $2,100s range, while the downtrend line continues to limit any rebound attempts so the short-term structure remains skewed to the downside.
At the same time, the short-term moving average began to reverse direction and move above the price, confirming the presence of selling pressure from the upside. The Bollinger Bands narrowed briefly when the market paused, then widened again when the sell-off resumed, reflecting increased volatility amid the decline.
The trading volume increases sharply when the biggest sell-off occurs, then decreases when the price tries to bounce. This pattern keeps the upside continuation stuck near the resistance area. As a result, the chart highlights the boxed area and the downtrend line as the two main technical obstacles that are currently shaping the direction of the short-term movement the most.
Follow us on Google News to stay up to date with the latest in crypto and blockchain technology. Check Bitcoin price, usdt to idr and tokenized nvidia stock price through Pintu Market.
Enjoy an easy and secure crypto trading experience by downloading the Pintu crypto app via Play Store or App Store now. Also, experience web trading with advanced trading tools such as pro charting, various order types, and portfolio tracker only at Pintu Pro.
*Disclaimer
This content aims to enrich readers’ information. Pintu collects this information from various relevant sources and is not influenced by outside parties. Note that an asset’s past performance does not determine its projected future performance. Crypto trading activities are subject to high risk and volatility, always do your own research and use cold hard cash before investing. All activities of buying and selling Bitcoin and other crypto asset investments are the responsibility of the reader.
Reference:
- Coinpaper. ETH Price Dips Below $2,050 as Charts Signal Critical Support Zones. Accessed on February 9, 2026