Bitcoin Slips Back to $68,000: What Could Be the Next Move for BTC?

Jakarta, Pintu News – Bitcoin stabilized around $70,600 after experiencing a sharp drop and then recovering quickly over the weekend. Now, two chart analysts are highlighting the $72,000-$75,000 level as a key area that could potentially determine the next direction of movement.
Then, how will the Bitcoin price move today?
Bitcoin Price Drops 1.34% in 24 Hours
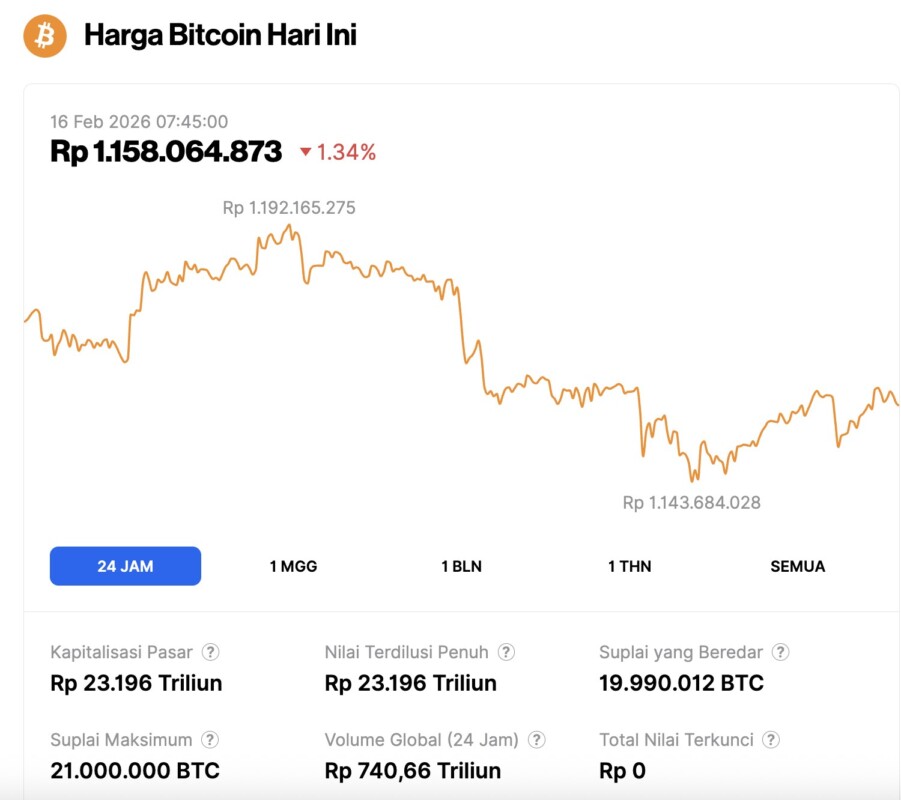
On February 16, 2026, Bitcoin was priced at $68,727, or approximately IDR 1,158,064,873, after posting a 1.34% decline over the past 24 hours. During that window, BTC traded as low as IDR 1,143,684,028 and reached a high of IDR 1,192,165,275.
At the time of writing, Bitcoin’s market capitalization is estimated at around IDR 23,196 trillion, while 24-hour trading volume has surged 12% to IDR 740.66 trillion.
Read also: 8 Crypto with High Rebound Potential after Market Sluggishness, What’s the Reason?
BTC Hangs Around $70,500 After Sharp Decline
Bitcoin bounced back over the weekend after experiencing a massive sell-off, trading around $70,572 on Binance’s BTC/USDT two-day chart. The latest candlestick shows a gain of about 2.5%, with the price moving from an open around $68,854 to a peak around $70,983.
Even so, the price movement is still below the resistance line marked around $72,825-a level that is considered the next direction-determining point.
A chart shared by trader TedPillows on X shows Bitcoin dropping from the $90,000s area to a rapid weakening phase that briefly pushed the price to the lower $60,000s before turning back up.
Since the drop penetrated the area of the previous move, the chart emphasizes the immediate demand levels around $65,944 and $60,421, as well as one lower level marked around $55,123. In essence, the rebound occurred after Bitcoin touched the zones that previously acted as support.
TedPillows mentions $72,000 as a key level to watch. He added that if the price is able to break that area, the market focus could shift to the $76,000 to $80,000 region which is shown on the chart as a resistance zone above.
On the other hand, he also highlighted $68,800 as another important level, linking it to the “CME gap” that traders often monitor as it is often “filled” by price movements.
Read also: 4 Signs Bitcoin is in the Early Phase of a Bear Market: When Will This Trend End?
Ali Charts Analyst Compares BTC Movement to S&P 500 Recovery
Bitcoin is holding at around $70,707 on the chart shared by Ali Charts. The analyst thinks BTC has the potential to replicate the S&P 500’s latest pattern if it manages to reclaim important support levels.
The chart puts the S&P 500 on the left and Bitcoin on the right, showing both of them falling sharply, then bouncing, with the next phase depicted as a further upside opportunity if support is re-established.
On the S&P 500 side, the index bounces after a deep drop and then moves up slowly until 2026, with the last reading marked at around 6,836. Meanwhile, the Bitcoin side shows a similar sequence: a steep sell-off until early 2026, then a quick recovery.
There is a horizontal line in the mid-$70,000s area that is considered a pivot point-the boundary between a potential deeper correction and a stronger recovery path.
Ali Charts said that if $75,000 is successfully reclaimed as support, it would “significantly increase the chances” of Bitcoin following a post-drop bull pattern as seen on the S&P 500 panel.
But as long as BTC remains below that threshold, that level remains the main reference to judge whether the rebound will last or weaken.
Follow us on Google News to stay up to date with the latest in crypto and blockchain technology. Check Bitcoin price, usdt to idr and tokenized nvidia stock price through Pintu Market.
Enjoy an easy and secure crypto trading and crypto gold investment experience by downloading the Pintu crypto app via Play Store or App Store now. Also, experience web trading with advanced trading tools such as pro charting, various order types, and portfolio tracker only at Pintu Pro.
*Disclaimer
This content aims to enrich readers’ information. Pintu collects this information from various relevant sources and is not influenced by outside parties. Note that an asset’s past performance does not determine its projected future performance. Crypto trading activities are subject to high risk and volatility, always do your own research and use cold hard cash before investing. All activities of buying and selling Bitcoin and other crypto asset investments are the responsibility of the reader.
Reference:
- Coinpaper. Bitcoin Price Prediction Points to $75K Test After Weekend Bounce. Accessed on February 16, 2026