As Ethereum Clings to $1,900, the Threat of a Massive Sell-Off Looms Over the Market

Jakarta, Pintu News – The downward trend in the price of Ethereum has continued, dropping close to the $2,000 level. While this correction may seem to be winding down, on-chain data indicates that the downward trend may not be over yet.
Although ETH price movement is currently stuck at a crucial level, network metrics still show that there is strong selling pressure. This condition raises the potential that the current market movement cycle could repeat the downtrend pattern from previous periods. Then, how will Ethereum price move today?
Ethereum Price Drops 0.07% in 24 Hours
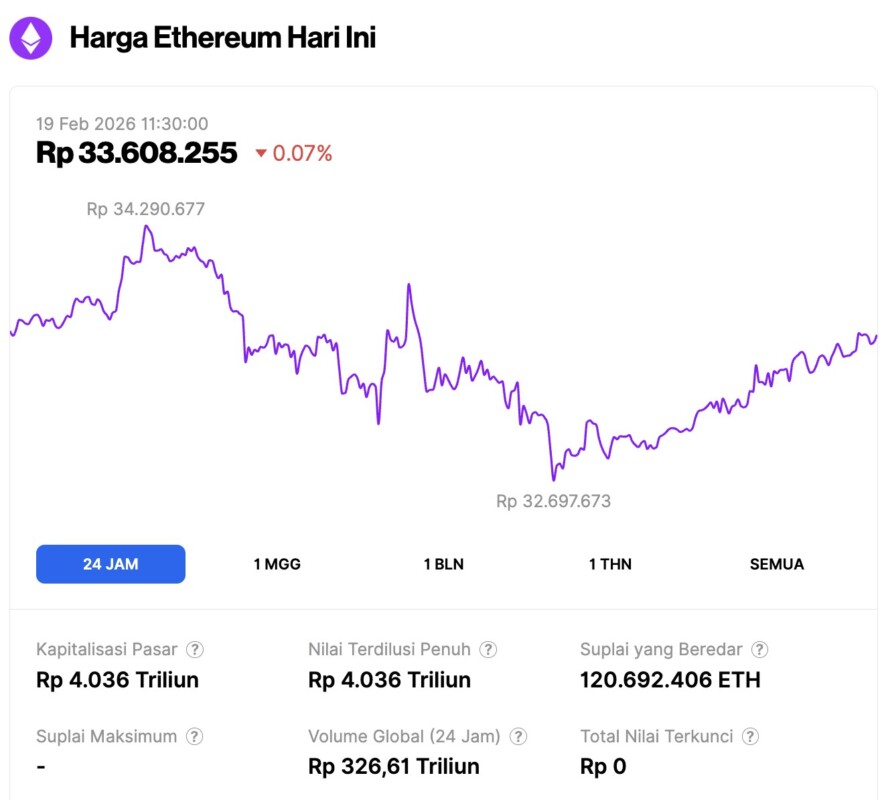
On February 19, 2026, Ethereum maintained a steady baseline near $1,975 (approximately IDR 33,608,255), registering a microscopic 0.07% uptick over the past 24 hours. Price action remained confined within a narrow range, oscillating between a low of IDR 32,697,673 and a high of IDR 34,290,677.
While the network’s overall market capitalization stands strong at IDR 4,036 trillion, a 6% decline in 24-hour trading volume—now sitting at IDR 326.61 trillion—suggests that investors may be waiting on the sidelines for a stronger signal.
Read also: Bitcoin Stumbles to $66,000 Today: Could a Weekly Golden Cross Spark a Sudden Comeback?
Ethereum (ETH) Potentially Repeats History of Decline
Since late January, Ethereum’s price has plummeted and has been stuck below the Realized Price level. This on-chain indicator reflects the average purchase capital of all coins in circulation, so a move below that level indicates the majority of investors are currently losing money.
This market pressure was reinforced by the Market Value to Realized Value (MVRV) ratio which settled below the 1.0 level. Historically, the phase of MVRV staying in the red for a long time always coincides with a deep market correction.
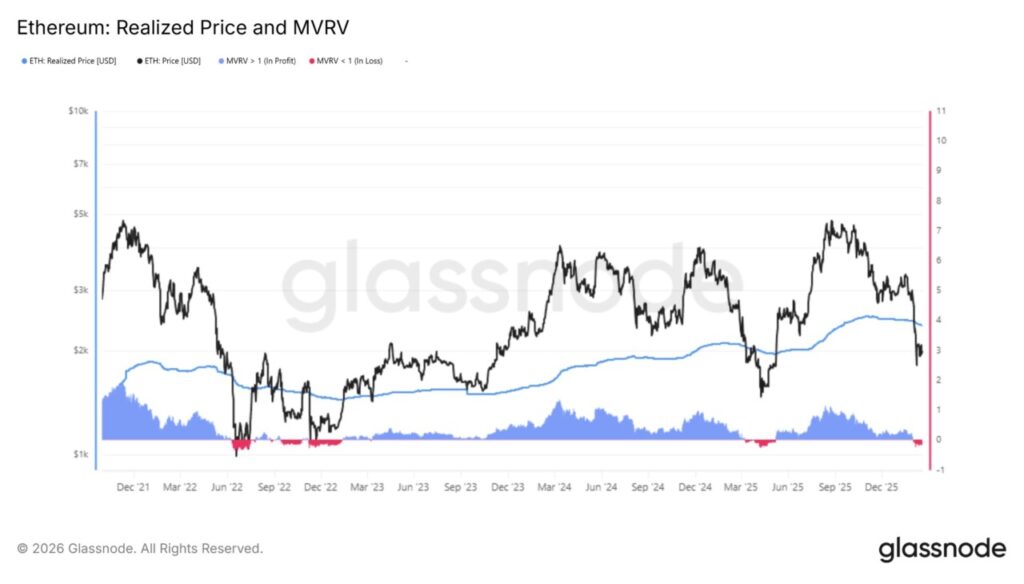
Based on past cycles, a recovery will indeed occur after the price has moved below the Realization Price for a long time. However, the revival phase generally only begins after the market has passed the point of mass capitulation.
Referring to previous bear market patterns, ETH is at risk of further declines in order to form a strong price floor before the market truly stabilizes.
ETH Sell-Off Gets More Massive
Exchange On-Balance data shows a surge in the supply of assets entering trading platforms. In the past week, approximately 445,000 ETH has flowed into various exchanges. At current price levels, the movement creates potential selling pressure worth more than $887,000,000.
An increase in balances on exchanges generally indicates a distribution phase. Ethereum (ETH) investors tend to move their assets to exchanges with the intention of selling them. The magnitude of recent inflows reflects the high level of caution among asset holders.
Read also: Meme Coin Price Prediction: Bear Pushes Dogecoin, Shiba Inu, and Pepe to the End of the Rope
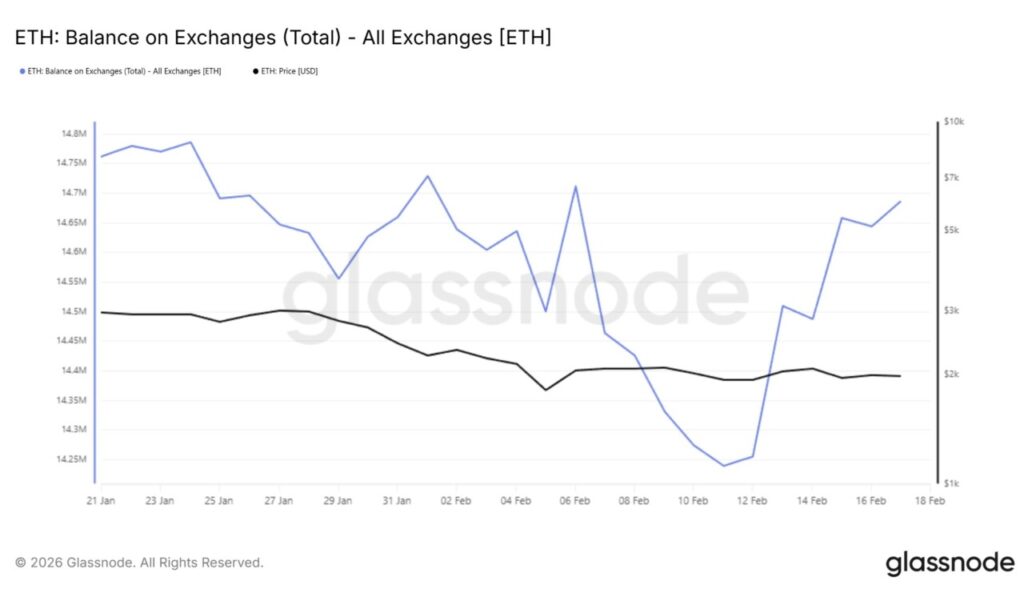
If prices fail to recover quickly, panic selling could potentially worsen. Historically, such spikes in deposits to exchanges often precede sharp corrections. The combination of unrealized losses and increased supply further magnifies downside risks.
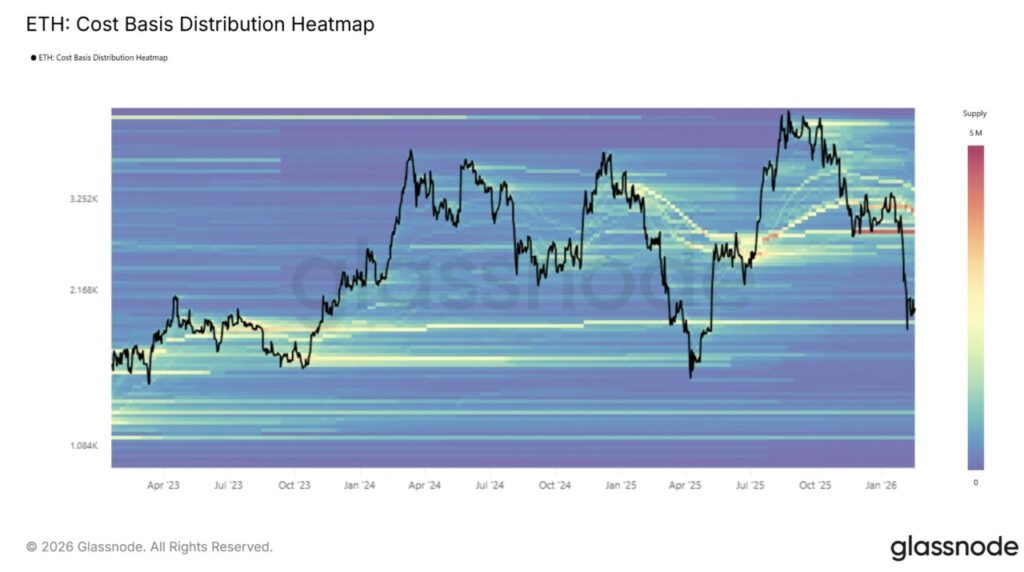
ETH Price at Risk of Falling Further
As of February 18, Ethereum was trading at $1,997. The $2,000 mark is a crucial psychological threshold. While this area may trigger short-term buying, the continued selling pressure minimizes the chances of a solid price bounce. According to the CBD Heatmap indicator, the next strong support level is at $1,866.
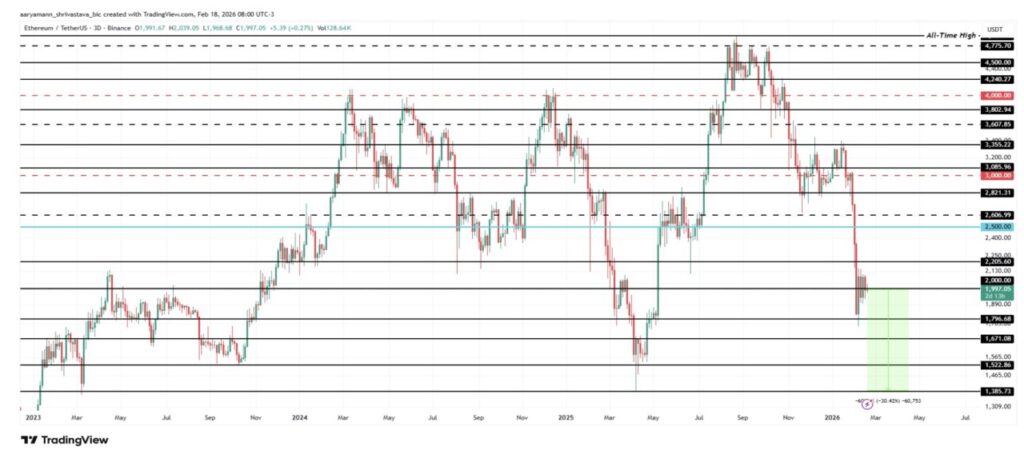
The support zone reflects past accumulation activity. If ETH prices break below $1,866, the risk of weakness will extend to the $1,385 level. This point has previously been a structural bottom in the last cycle. A drop to the $1,385 area is equivalent to a price drop of about 30% from where it is now. The next major support is in the range of $1,231.
Conversely, a change in investor behavior could reverse the direction of the trend. If asset holders reduce deposits to exchanges and return to accumulation, ETH prices have a chance to stabilize above $2,000. A short-term price recovery could aim for a target of $2,205. If buying pressure continues to strengthen, the price could skyrocket to $2,500, while breaking the current pessimistic market projections.
Follow us on Google News to stay up to date with the latest in crypto and blockchain technology. Check Bitcoin price, usdt to idr and tokenized nvidia stock price through Pintu Market.
Enjoy an easy and secure crypto trading and crypto gold investment experience by downloading the Pintu crypto app via Play Store or App Store now. Also, experience web trading with advanced trading tools such as pro charting, various order types, and portfolio tracker only at Pintu Pro.
*Disclaimer
This content aims to enrich readers’ information. Pintu collects this information from various relevant sources and is not influenced by outside parties. Note that an asset’s past performance does not determine its projected future performance. Crypto trading activities are subject to high risk and volatility, always do your own research and use cold hard cash before investing. All activities of buying and selling Bitcoin and other crypto asset investments are the responsibility of the reader.
Reference:
- BeInCrypto. Ethereum Trades Under Realized Price as Exchange Inflows Top $887 Million. Accessed on February 19, 2026