What is Double Top Pattern?
The double top is one of the most important chart patterns for traders. It can be used to take profit or as an entry point to place a short position. Essentially, it is a pattern that signals a reversal from bullish to bearish. Interested in learning more about the double top pattern and its application in trading? Check out the full article below.
Article Summary
- 📉 Double top is a pattern that signals a reversal from bullish to bearish.
- 🌄 A double top consists of two consecutive high points, separated by a lower low, forming a neckline.
- 🔍 The double top pattern is confirmed when the price falls from the second peak and breaks the neckline.
- 💡 Traders can utilize the second peak as an optimal profit-taking area. Traders also can start placing short positions when the price drops below the neckline.
What is a Double Top Pattern?
A double top pattern is a technical chart pattern that signals a potential reversal from an uptrend to a downtrend. As the name suggests, this pattern forms when the price reaches two equal highs, separated by a lower low. Visually, it resembles two mountain peaks with a valley in between.
At the first peak, the price action forms an inverted U-shape, indicating a potential reversal from a prolonged uptrend. This bearish reversal or consolidation then creates a valley or trough.
However, the price subsequently rebounds and rallies to form a second peak. After reaching this second high, the price action typically retraces. It fails to exceed the first peak, suggesting a loss of momentum and an inability to break through resistance.
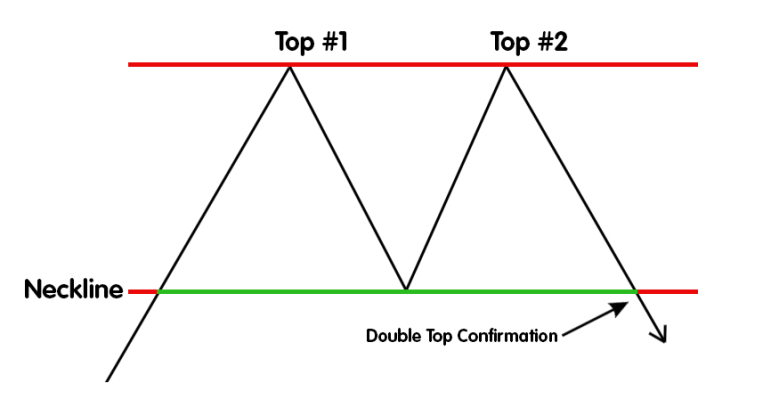
A double top pattern is confirmed when the asset’s price breaks below the support level that connects the low points between the two peaks, known as the neckline.
A double top formation can also be interpreted as traders or investors seeking to take profits from an uptrend
Key Elements for Identifying a Double Top Pattern
Several elements can help identify a double top pattern:
- Uptrend. Before the formation of a double top, the asset’s price must be in an uptrend, indicated by a series of higher highs and higher lows.
- Two Peaks. Two peaks, approximately at the same price level, must be formed. These peaks act as key resistance levels where the price stalls and then retrace.
- Trough. A trough must form between the two peaks. This area represents a temporary correction or consolidation phase before the second leg of the uptrend.
- Neckline. A neckline is a horizontal line drawn from the lowest point of the trough. It serves as a support level and a confirmation point for the double top pattern.
- Neckline Breakdown. When the second peak is reached, but the price fails to break through resistance and falls below the neckline, it signals a potential reversal. This confirms the formation of a double top pattern.
Double Top Pattern Example
The following daily Ethereum chart exemplifies a double top pattern. In early March, ETH experienced a rally, peaking at IDR 64,398,000 on March 12. This level became the first peak and a significant resistance point for ETH.
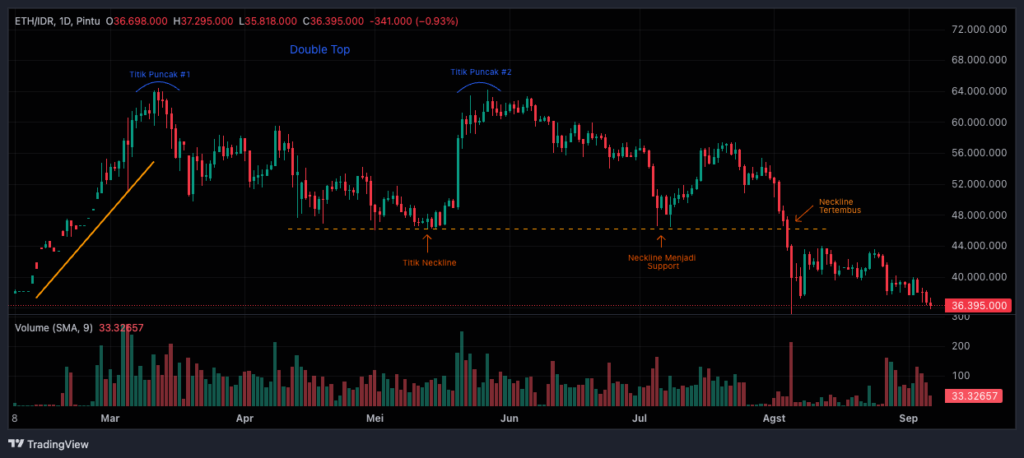
Afterward, the price of ETH declined, and a trough/valley was formed. The downward trend ended at a low of IDR 46,200,000, establishing this area as a support level.
Shortly after, ETH embarked on another rally to retest the resistance level. Unfortunately, ETH lost momentum around IDR 64,186,000, forming the second peak. While the double top pattern was evident, it was not yet confirmed.
Following the second peak, ETH experienced another correction. On July 5th and 8th, ETH briefly touched the support level but rebounded. However, on August 4, it broke below the support (neckline), confirming the double top pattern.
Since then, ETH has been in a downtrend. The price may decline until a positive sentiment emerges to reverse the trend. As of writing this article, ETH has dropped by 43.28% from its second peak, reaching IDR 36,336,000
Pros and Cons of the Double Top Pattern
The advantage of the double top pattern is that it clearly indicates support and resistance levels through the peak and neckline. Thus, traders can easily identify entry or exit points.
However, the double top pattern can give false signals like any other technical indicator. On the one hand, the identification process is also quite subjective, so that it can result in different interpretations from one another.
Therefore, the double top pattern should not be the only reference in trading decisions. Use other technical indicators to provide more reliable signals. In addition, risk mitigation such as stop-loss should be kept ready to avoid losses when the movement is not as expected.
Trading Strategy with Double Top Pattern
There are several trading strategies that can utilize the double top pattern. The first strategy is to use the double top as an exit point to take profits. This strategy can be applied to those already positioned before the double top pattern forms.
Therefore, when the price fails to break through resistance and forms a second peak, it is advisable to take profits immediately. This indicates a potential trend reversal.
The double top pattern is confirmed when the price falls below the neckline. In this situation, selling all of your assets (if you still have a position) is recommended, as the price will continue to fall.
The second strategy is to utilize the neckline breakout point as an entry point to place a short position. When the price breaks through the neckline, the double top is confirmed, and the price is expected to fall. However, be cautious, as the price may test the neckline before entering a downtrend.
To avoid risks, traders can place a stop-loss above the neckline or the most recent swing high. Additionally, placing a short position can be done when the price has stopped attempting to test the neckline and has started its bearish trend.
Use additional technical indicators to make the double top signal more reliable. For example, the appearance of a bearish divergence on the MACD histogram or RSI when the indicator shows a lower high while the price reaches the second peak.
Conclusion
A double top pattern is a pattern that gives a bearish signal. When this pattern forms, it implies that the uptrend rally is starting to lose steam and has the potential to decline. The key element to confirm the formation of a double top pattern is when the price drops through the neckline after reaching the second high.
For traders, the second point can be the optimal profit-taking point, as the price will enter a correction phase afterward. In addition, the neckline point can also be used as an entry point for traders who want to short as prices are expected to continue to fall. However, a double top can give false signals like any other technical indicator. Combining it with other technical indicators will provide more reliable signals.
How to Buy Crypto on Pintu
Looking to invest in crypto assets? No worries, you can safely and conveniently purchase a wide range of cryptocurrencies such as BTC, ETH, SOL, and others safely and easily at Pintu. Pintu diligently evaluates all its crypto assets, highlighting the significance of being cautious.
Pintu is also compatible with popular wallets such as Metamask to facilitate your transactions. Download Pintu app on Play Store and App Store! Your security is guaranteed because Pintu is regulated and supervised by Bappebti and Kominfo.
Aside from buying and trading crypto assets, you can expand your knowledge about cryptocurrencies through various Pintu Academy articles. Updated weekly, all Pintu Academy articles are made for knowledge and educational purposes, not as financial advice.
References
- James Chen, Double Top: Definition, Patterns, and Use in Trading, Investopedia, accessed on 6 September 2024.
- School of Pipsilogy, How to Trade Double Tops and Double Bottoms, BabyPips, accessed on 6 September 2024.
Share