Market Analysis 14-20 November 2022: FTX Impact Still Continues, Bitcoin Moves Sideways

After the FTX incident that ravage the crypto market, Bitcoin managed to stay in the $16k price range. Several major crypto players have just announced the losses they have suffered due to the FTX event. While there is still uncertainty regarding this impact, crypto assets still look sluggish. The Pintu Trader Team has collected various important data about the movement of the crypto market over the past week. However, you should note that all the information in this Market Analysis is for educational purposes, not financial advice.
block-heading joli-heading" id="market-analysis-summary">Market Analysis Summary
- 🗂️ The recent inflation report (CPI) shows that inflation is peaking. However, there has not been a consistent downward trend.
- ⚠️ During the week that followed the FTX chaos, other events began to unfold. The business unit of Genesis Global Trading suspended the withdrawal of loan funds and stopped new loans on its platform. In addition, Gemini also stopped withdrawing funds from the Gemini Earn product. Both of these platforms are feeling the effects of the FTX bankruptcy.
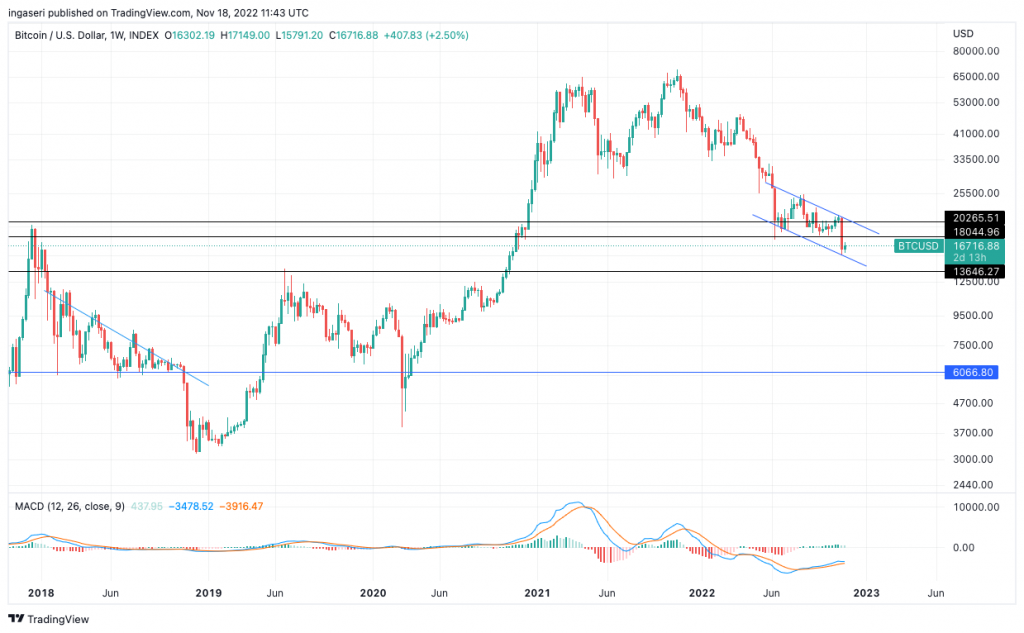
- ⚖️ On the Bitcoin chart, there is strong support in the 13-14k price range. The current price point probably won’t last if there is another significant piece of news impacting the crypto. market.
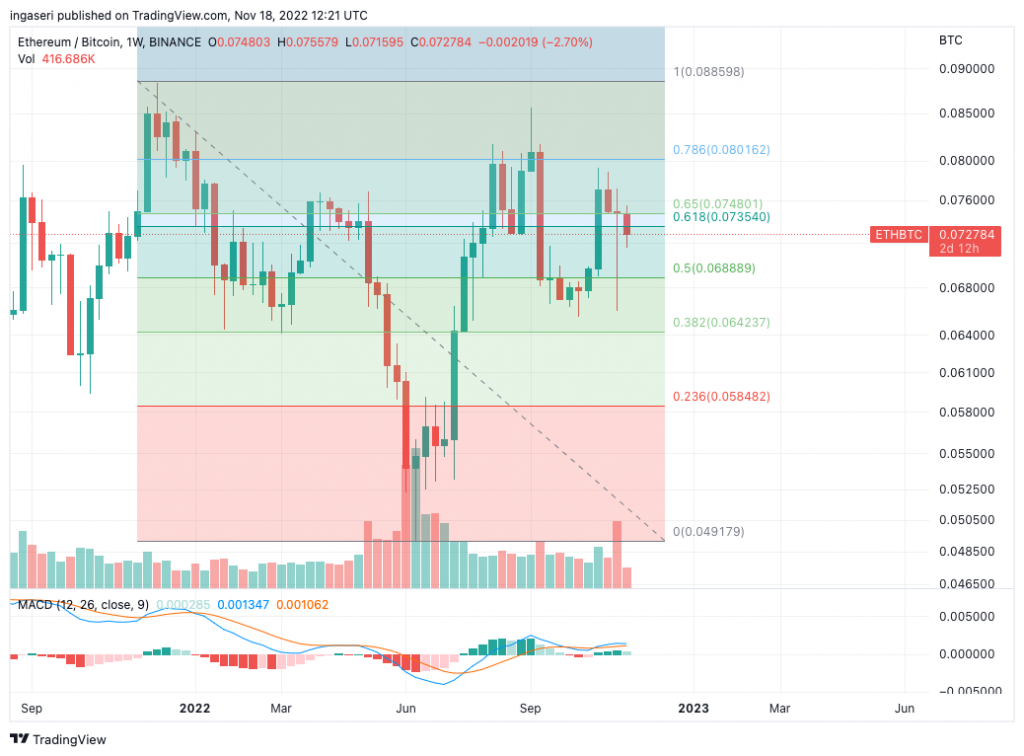
- 📊 On the ETH/BTC chart, we are in the golden pocket of Fibonacci. If ETH loses its support in this zone, there will be a significant drop in the price of ETH against BTC.
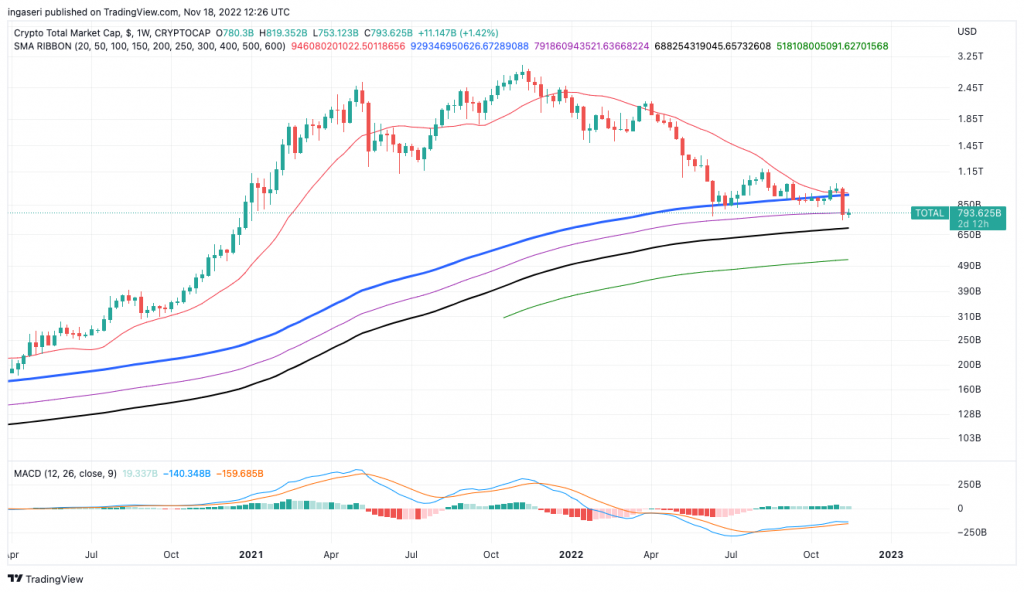
- 🧠 Total market cap crypto hit resistance at the 250-week MA. If it falls from this line, we could experience another downward trend in the coming week.
Macroeconomy Analysis
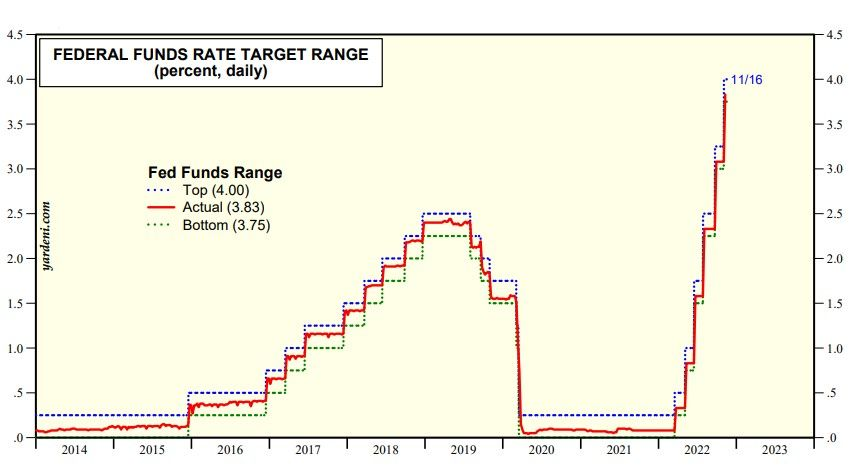
St. Louis Fe President James Bullard says that monetary policy tightening since March appeared to have had only limited effects on inflation. This statement has caused the equity markets to jerk and fall after gaining positive momentum over the week. Bullard suggested that the Fed might need to increase the rate till the FFR need to be in the 5-7% range to bring the inflation down.
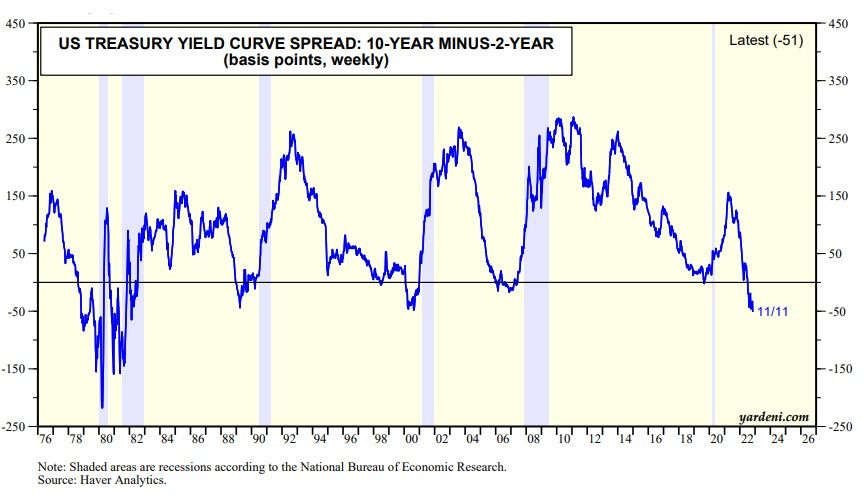
The 10-year US Treasury bond yield dropped sharply from 4.25% on October 24 to 3.8%. The recent CPI reading suggests that inflation is peaking, although we have yet to see a consistent downward trend for confirmation that the worst is over.
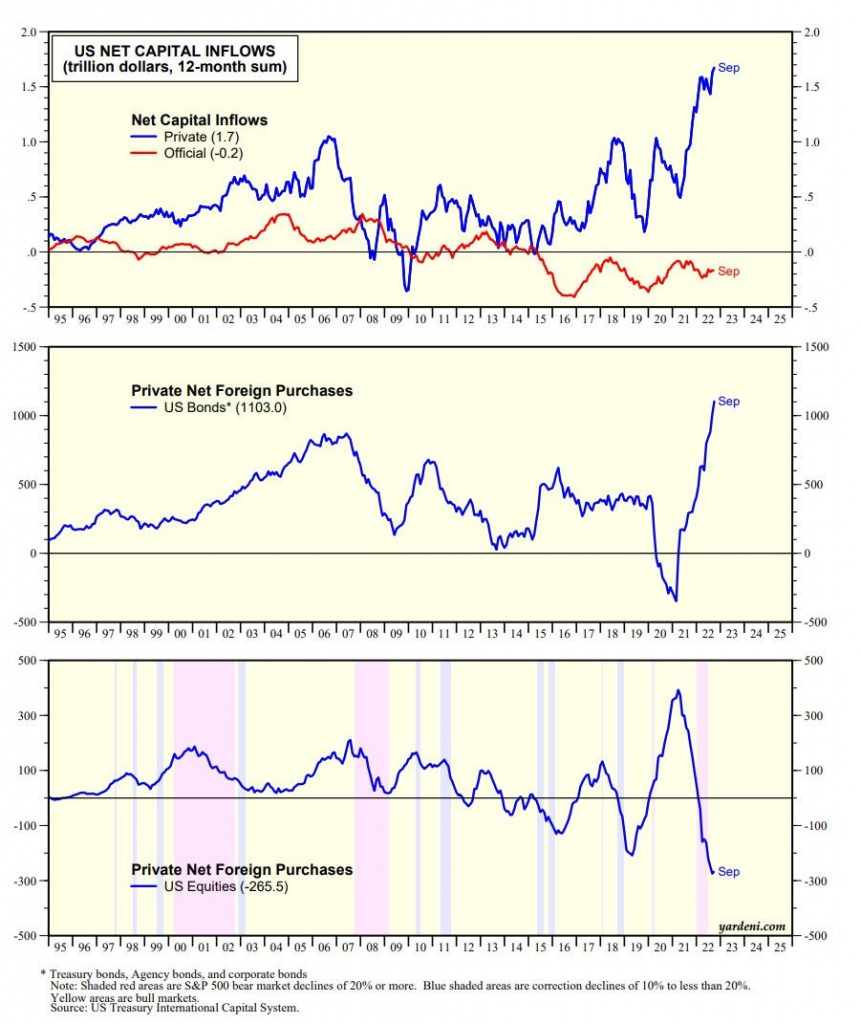
The dollar continued its rally by net inflows of capital. Over the past 12 months through September, private inflows jumped to a record $1.7 trillion. Additionally, foreigners’ net purchases of US bonds soared to a record $1.1 trillion.
The Aftermath of the FTX Fallout
Over the week, after the FTX turmoil, more events unfolded as expected. First, we have the lending business arm of the crypto investment bank, Genesis Global Trading, known as Genesis Global Capital temporarily suspending redemptions and new loan originations in the wake of FTX’s collapse. Genesis disclosed earlier that its derivatives unit had about $175 million in FTX. Its parent company, DCG (Digital Currency Group) had earlier infused Genesis with 140 million of equity.
Next, Gemini reportedly was forced to temporarily halt withdrawals on its Gemini Earn program where customers earn interest on their digital currency. Their earn accounts were frozen after its main lender Genesis reported a similar freeze.
Investors are pulling funds out of major CEX as a result of FTX’s collapse. We have outflows from major exchanges, with Gemini, OKX, and Crypto.com having the most outflow of funds.
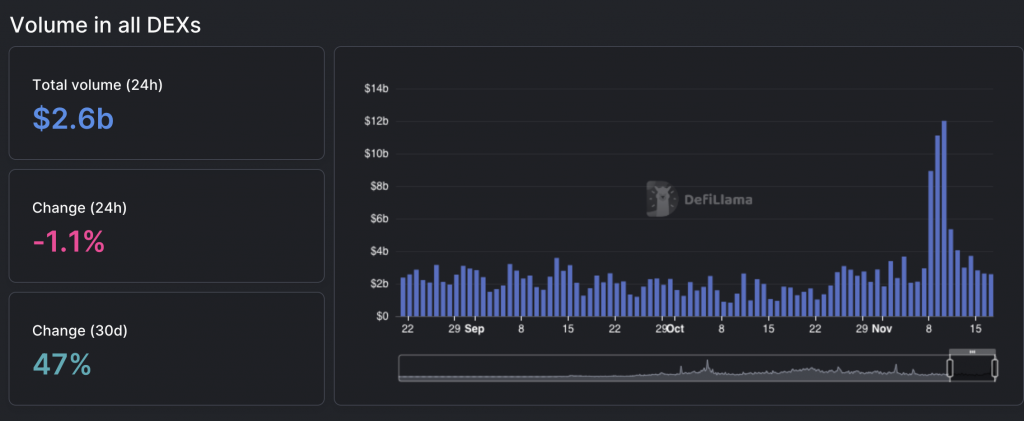
The decentralized exchanges have seen a significant influx of funds from CEX. Hence the higher trading volume over the past 2 weeks is shown below.
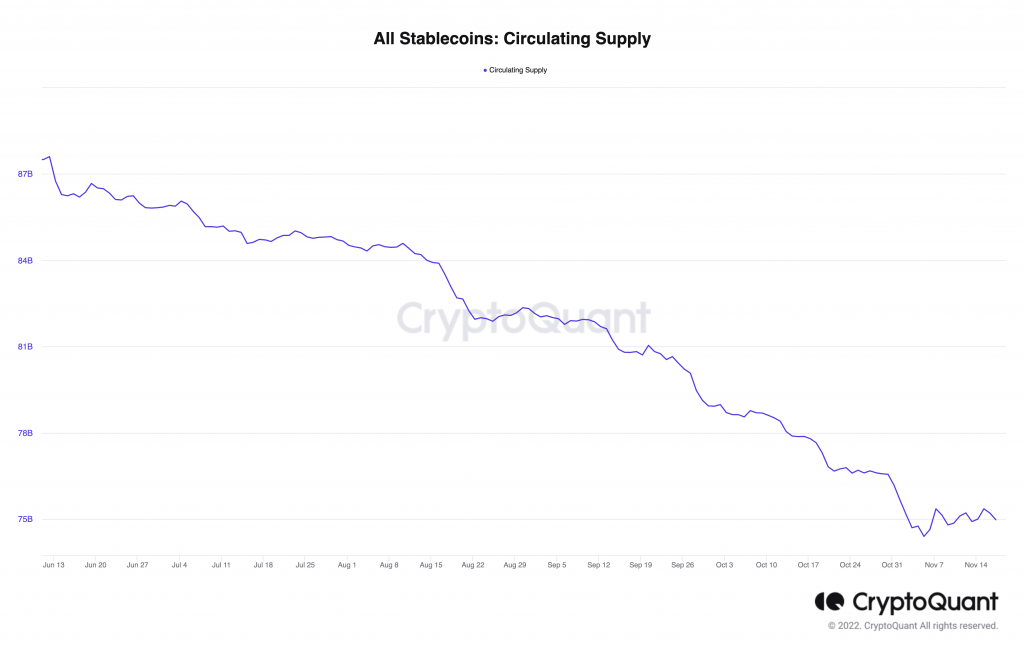
The stablecoin market cap is decreasing, which will continue to hurt major crypto prices. The market will struggle for quite some time, despite the economic indicators getting better. The FTX fallout has made things sour for the crypto market at least for the next few months.
Bitcoin Price Movement 14-20 November
BTC is currently moving sideways after the FTX implosion. There is strong support at the 13-14k price range. The current price might not hold should there be another significant news impacting the crypto market (effects of FTX). We can see that a falling wedge pattern is forming, and since we are in a downtrend, expect a short-term reversal to the upside.
You can learn more about price patterns in “5 Crypto Price Chart Patterns to Learn“.
Ethereum Price Movement 14-20 November
Let’s take a look at ETH/BTC chart, notice that we are at the Fibonacci golden pocket. If we fall from the support at the bottom channel of the pocket, expect a significant ETH value drop relative to BTC.
On-Chain Analysis
The total crypto market cap has hit resistance at 250 weeks MA. Should we close below this line, expect more downward trends in the coming week.
📊 Exchange: As the exchange reserve continues to fall, it indicates lower selling pressure. Net deposits on exchanges are high compared to the 7-day average. So, higher deposits can be interpreted as higher selling pressure.
💻 Miners: Miners are selling holdings in a moderate range compared to their one-year average. Also, miners’ revenue is decreasing significantly compared to the cost they put in. This could indicate that the price is undervalued along with the increasing miner’s motive to hold their coins.
🔗 On-chain: More investors are selling at a loss. It can indicate a market bottom in the middle of a bear market. Long-term holders’ movement in the last 7days was higher than the average. If they were moved for the purpose of selling, it may have a negative impact. Investors are in a capitulation phase where they are currently facing unrealized losses. Finally, this indicates the decreasing motive to realize loss which leads to a decrease in sell pressure.
🏦Derivatives: Long-position traders are dominant and are willing to pay short traders. Furthermore, buying sentiment is dominant in the derivatives market. More buy orders are filled by takers. As open interest decreases, it indicates investors are closing futures positions and the possibility of trend reversals. So, this might trigger the possibility of a long/short squeeze caused by sudden price movement or vice versa.
⚙️ Technical: RSI indicates an oversold condition where 73.00% of price movement in the last 2 weeks has been down and a trend reversal can occur. Besides, Stochastic RSI indicates an oversold condition where the current price is close to the bottom of the last 2 weeks and a trend reversal can occur.
Altcoin News
- ⚛️ ATOM 2.0 proposal rejected: The ATOM 2.0 proposal that plans to overhaul the Cosmos ecosystem was rejected by a number of validators. This proposal received 47.51% agree, 37.39% disagree, and 13.27% abstain. However, 36.89% who disagreed chose the NoWithVeto option, which means they strongly oppose the proposal. One of the Cosmos validators explained that the proposed plan for ATOM 2.0 was too broad and needed to be divided into several proposals.
- 🌊 Sui Launches Testnet: Sui has decided to launch phase 1 incentivized testnet. This testnet will focus on seeing testing validators of the Sui network. Sui will involve many third-party validators in this testnet. Lastly, Sui explained that there are no airdrop plans for SUI tokens and anyone who participates in this testnet will not be rewarded.
More News from Crypto World in the Last Week
- 🦹 FTX Stolen Funds: The hacker who stole funds on FTX is now moving and changing the assets they stole. According to Chainalysis, this hacker had 228,523 ETH and started converting it to wBTC and renBTC. However, the identity of the FTX hackers is currently unknown.
- 🪙 Bitcoin El Salvador: President of El Salvador, Nayib Bukele, announced that he will buy 1 Bitcoin every day. Currently, El Salvador is rumored to own around 2,381 BTC but this figure cannot be verified as the transaction data is not made public.
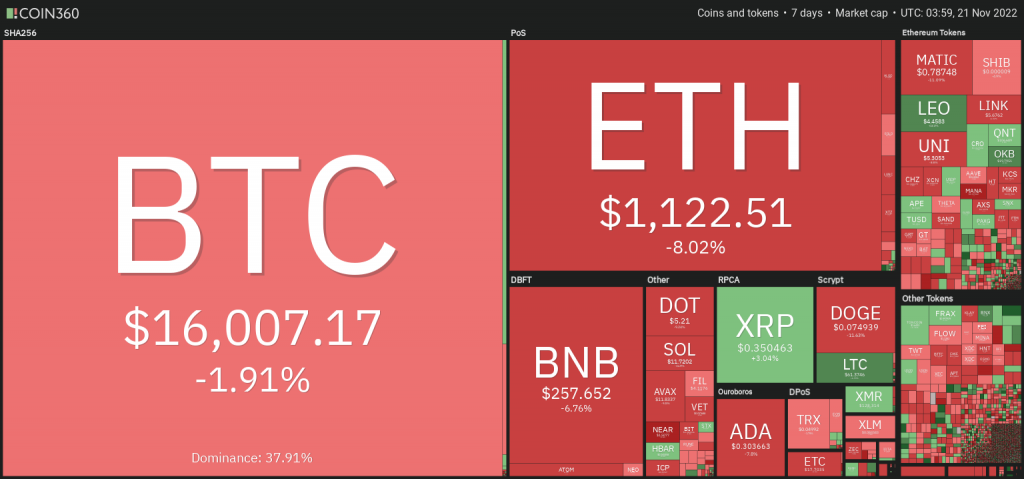
Cryptocurrencies Market Price Over the Past Week
Cryptocurrencies With the Best Performance
- Litecoin (LTC) +11,76%
- Cronos (CRO) +11,37%
- Apecoin (APE) +10,36%
- Lido DAO (LDO) +9,31%
- Quant (QNT) +8,11%
Cryptocurrencies With the Worst Performance
- Near Protocol (NEAR) -18,03%
- Curve DAO (CTV) -15,38%
- Axie Infinity (AXS) -13,66%
- Decentraland (MANA) -11,75%
References
- Bessie Liu, No With Veto: Cosmos Community Rejects ATOM 2.0 White Paper, Blockworks, accessed on 21 November 2022.
- Sui Testnet, @suiNetwork, accessed on 21 November 2022.
- Jeffrey Albus, FTX funds on the move as thief converts thousands of ETH into Bitcoin. Coin Telegraph, accessed on 21 November 2022.
- Andrew Asmakov, El Salvador to Start Buying 1 Bitcoin Every Day Says President Bukele, Decrypt, accessed on 21 November 2022.
Share