5 Crypto Price Chart Patterns to Learn
One of the most important things about investing in crypto is understanding the right time to buy and sell your assets. One of the most popular ways to understand this is to do technical analysis. In simple terms, technical analysis is a method for reading and interpreting the price chart of an asset. This analysis is done so that you can determine the current trend, predict the short-term timeframe, and also determine when to buy and sell assets. An important part of technical analysis is identifying patterns on a candlestick price chart. These patterns can provide a variety of information for you. So, what are the candlestick patterns that you need to know? How do you identify it? This article describes the various candlestick patterns.
Article summary
- 📈 A chart pattern is a series of connections between price points that create a unique shape and are identified using trend lines. These patterns emerge when market participants buy and sell at certain levels. These levels usually repeat over a long period of time, creating price patterns.
- 📊 There are 2 types of price patterns, continuation and reversal patterns. A reversal pattern is a price pattern that indicates a trend change is happening. Meanwhile, the continuation pattern is a price pattern that continues the current trend.
- 🗂️ An important principle in technical analysis is that the analysis you make has the possibility of being wrong. sometimes we make a biased analysis that predicts price movements according to what we want, not the facts.
What is a price chart pattern?
A chart pattern is a series of connections between price points that create a unique shape and are identified using trend lines. In long-term price movements, transitions between up and downtrends create different types of price patterns that we can recognize. Patterns on price charts usually have a shape that we usually know such as when a triangle, box, flag, or head & shoulder. These patterns appear as market participants buy and sell at certain levels. These levels usually repeat over a long period of time, creating price patterns.
Investors and traders often use a wide variety of price patterns to analyze current movements and predict future market movements. Recognizing and finding patterns on price charts is an important part of technical analysis. Investors identify these patterns and then take advantage of technical indicators to get confirmation and wait to see if their predictions are correct or not.
The science of Identifying and analyzing price patterns has been around since trading started. Therefore, the patterns below are something that has been around for decades, since the beginning of Forex and stock trading.
Two types of price chart patterns
1. Reversal
When the price reaches a peak, the reversal pattern is a sign that the enthusiasm of buyers is starting to run out and investors are starting to sell (referred to as the distribution stage). Conversely, in a low price position, enthusiasm for the asset starts to increase and many investors start buying (referred to as the accumulation stage). The most important thing incorrectly identifying a reversal pattern is to look at the volume of transactions that occur because the reversal will occur in high volume.
2. Continuation
The continuation pattern is a price pattern that continues the current trend. This pattern is usually a period of rest before the trend resumes, whether it’s a downtrend or an uptrend. The continuation pattern is divided into 2 based on the trend, namely bearish and bullish continuation patterns. The bearish continuation pattern is a signal that we can use to sell assets before the price continues to decline. On the other hand, the bullish continuation pattern is a signal to buy the asset before it resumes the uptrend.
One of the important things to note about the continuation and reversal patterns is that sometimes the price chart doesn’t give us complete information so we can’t draw definite conclusions. In addition, a pattern sometimes has the potential to move in both directions, creating the potential for the continuation and reversal of one pattern. This happens because price movements are influenced by many variables. Therefore, your analysis needs to consider various scenarios that can occur.
Examples of several popular price chart patterns
1. Rising & Falling Wedge
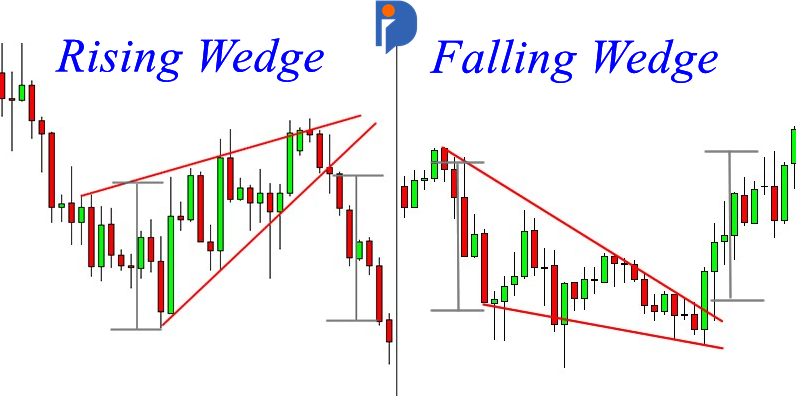
The rising and falling wedge patterns are both patterns that have the potential to form a trend reversal and a continuation. However, in general, these two patterns are signals of a reversal pattern. You draw these two patterns using two trend lines that form a convergence pointing up or down according to the trend.
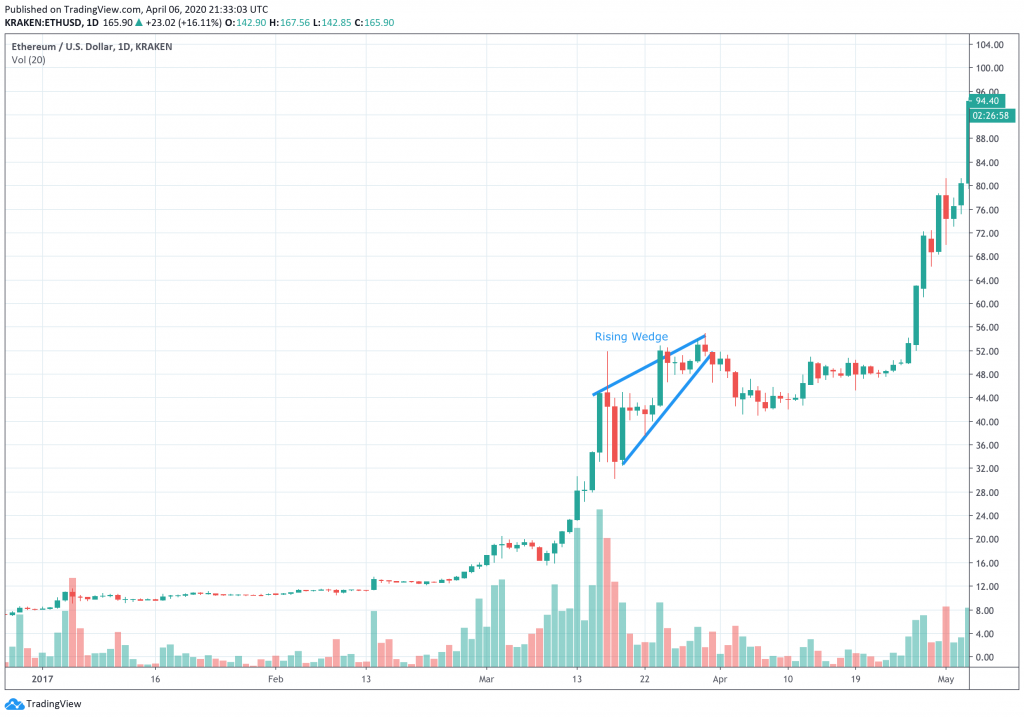
In the rising wedge pattern, even though the price of an asset continues to increase, its trading volume will decrease. In the picture above, it can be seen that the transaction volume tends to decrease until the end of the wedge. After that, the price decreased in the short term but continued its upward trend. Conversely, a falling wedge is formed when the price continues to decline and forms an upper price point that is getting lower until it reaches the breakout point (in a reversal pattern) or the price drops drastically (in a continuation pattern).
The way to tell whether the wedge pattern will be part of a reversal or continuation pattern is to see how drastic the price changes and the volume of transactions are.
2. Head & Shoulder and Inverse Head & Shoulder
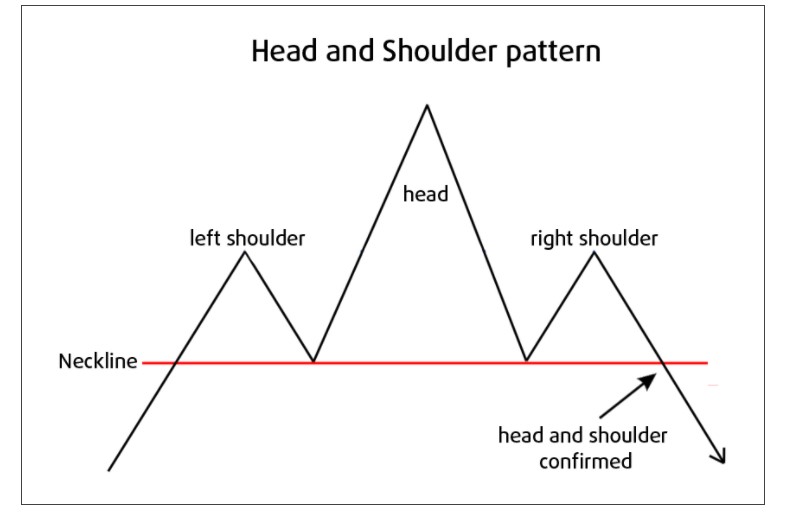
Head & Shoulder is a price chart pattern that belongs to the category of a reversal pattern. One of the unique things about this pattern is that it can be a bearish or bullish signal depending on the direction of the pattern. Head & Shoulder forming a hill to the top is a sign of a bearish reversal trend. Meanwhile, the Inverse Head & Shoulder pattern is forming downwards, indicating a bullish reversal pattern.
The head & shoulder price pattern starts with an asset reaching its top price (left shoulder), dropping, then making a second higher top. Finally, the asset price goes back down and creates a final high point (right shoulder) which is similar to the first high point. When viewed, these 3 top points will form 3 hills with the middle hill higher than the others, like a head with left and right shoulders. The most important thing in a head & shoulder pattern is a neckline, which is a straight line that is drawn as a foundation when prices fall. If the price declines after the right shoulder drop through this line, it means that the head & shoulder pattern has been confirmed.
On the other hand, inverse head & shoulder forms 3 hills that point downwards. It is a signal of the formation of a bullish reversal trend where the price will reverse and increase. Like a regular head & shoulder pattern, confirmation of this pattern must wait for the price to rise above the predetermined neckline.
3. Cup & Handle price chart pattern
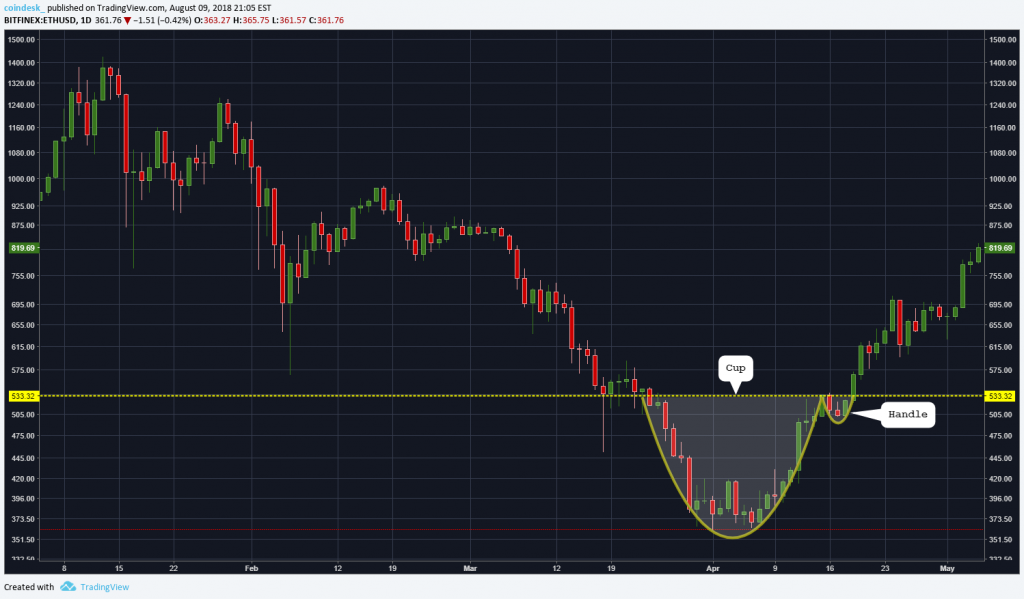
The cup & handle pattern is a price pattern that falls into the bullish reversal pattern category where the bearish trend starts to reverse and the price increases. Cup & handle, as the name suggests, forms a U-shaped cup with a small handle. This pattern begins with an asset that has experienced a deep price decline and then undergoes a U-shaped price recovery, returning its price to its original point. After that, it formed a small U that acted as the handle of the cup before the price broke upwards, confirming a breakout and trend reversal.
This pattern is most accurate when we use the daily price chart so that we are not disturbed by price fluctuations that occur on the hourly chart. The price conditions in this pattern is an ideal moment for you to buy the asset shortly after a breakout is confirmed.
4. Double top and bottom
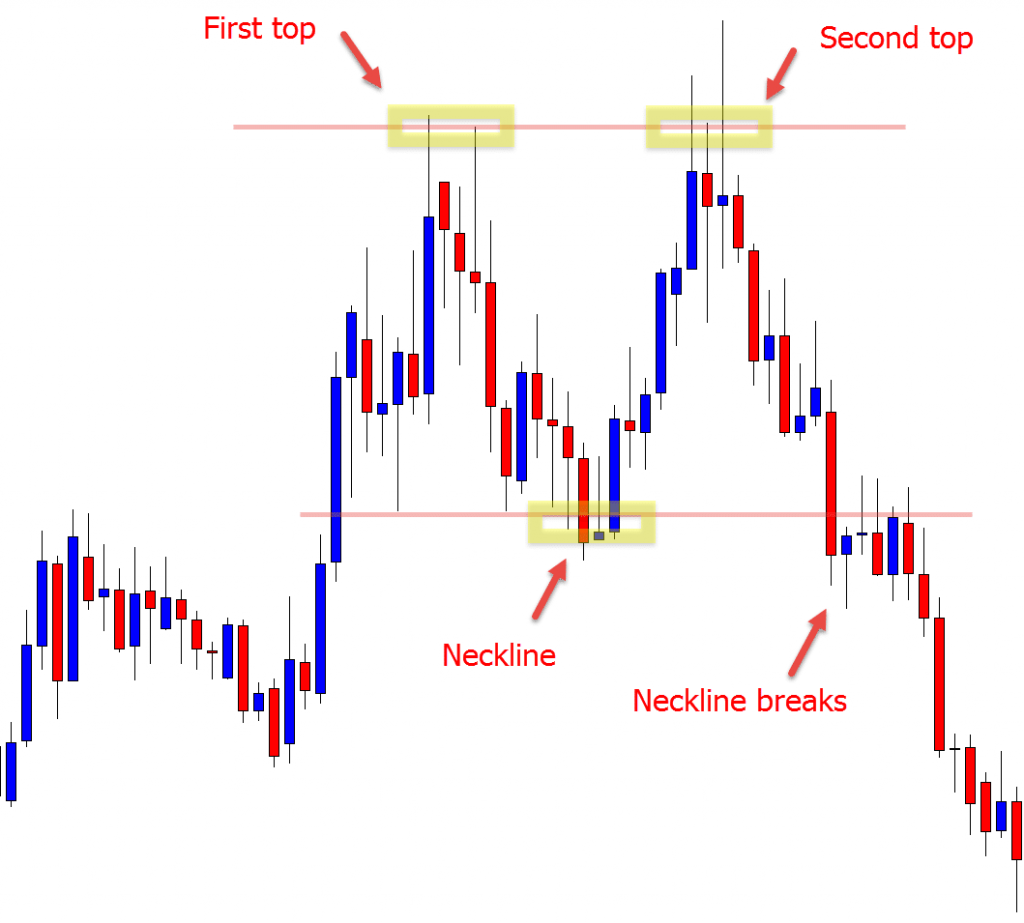
Double Top and Double Bottom are price chart patterns that signal trend reversals. The double top and double bottom patterns create the shape of the letters M and W. Additionally, these two patterns are quite easy to identify because they only rely on support and resistance levels. Both are created when an asset fails to break through support or resistance levels then proceeds to do a reversal. A double top is a bearish reversal pattern while the double bottom is a bullish reversal pattern.
In the double top price chart pattern, the price of the asset first tries to break through the resistance level, drops to the previous level, then tries to break through the price again but fails. Both attempts to break the resistance level formed the same 2 hills then pushed the price into a downward trend, completing a bearish reversal trend. On the other hand, the double bottom pattern was an attempt to break the support level that failed and created a catalyst for trend reversal. After 2 attempts to break the support level failed, the double bottom pattern pushed the price chart to reverse and experienced a price increase.
One of the things you need to correctly identify to get confirmation of the two patterns above is whether the price can break the support and resistance levels that have been formed. In addition to the two patterns above, there are other patterns, namely triple top & bottom. Double top and double bottom are more common than triple patterns. However, triple patterns are often a signal of a stronger reversal playing out.
5. Ascending & Descending Triangle

The ascending and descending triangle patterns are price chart patterns that are formed as a continuation pattern of the current trend but can also be a sign of a reversal or trend reversal. You need to pay attention to the price movement of the asset at the end of the triangle shape to see if it is a continuation or reversal pattern.
The ascending triangle pattern begins with a drastic downward movement until the price reaches the point of consolidation. At this point, the price is consistently moving to create a higher low and at least 2 similar highs. This continues to happen to build momentum to the point where it will continue the previous bullish trend or a downward trend reversal occurs.
The descending triangle pattern usually forms in a bearish trend where the price continues to decline and forms several lower highs and then falls through the support level at the end of this pattern.
Basic principles in identifying price chart patterns
- 🔁 Always look for additional confirmations: Confirmations are situations where the price movement of an asset follows the predictions or conditions that you have set. Pattern analysis will be more accurate when you get several confirmations that indicate the price moves according to your analysis.
- 📊 Pay attention to the volume on the price chart: Trading volume is a simple indicator that you can use in various technical analyses including identifying price patterns. Volume can also give an early sign of a trend reversal or continuation.
- ❓ Technical analysis is not an exact science: An important principle in technical analysis is that the analysis you make has the possibility of being wrong. Sometimes we make biased analysis that predicts price movements according to what we want, not facts.
- 📈 Create accurate trendlines: A trendline is a line that connects several important price points in a chart. Accurate trend lines are an important part of the technical analysis of cryptocurrencies. Make sure the trend line you create touches important price points at the bottom or top of the price chart.
Buying cryptocurrencies
You can start investing in cryptocurrencies in the Pintu app. Through Pintu, you can buy cryptocurrencies such as LUNA, BTC, etc in an all-in-one convenient application.
Pintu is also compatible with popular wallets such as Metamask to facilitate your transactions. Download the Pintu app on Play Store and App Store! Your security is guaranteed because Pintu is regulated and supervised by Bappebti and Kominfo.
You can learn more about cryptocurrencies through the various Pintu Academy articles that we update every week! All Pintu Academy articles are made for educational purposes only, not financial advice.
FAQ
1. What is a price chart pattern in technical analysis?
A price chart pattern is a visual formation reflecting market behavior used to predict future price direction.
2. Why are price chart patterns important for crypto traders?
They provide trend signals and help traders make more accurate buy or sell decisions.
3. How do you read a chart pattern to determine entry and exit points?
Traders wait for a breakout confirmation and use support or resistance levels as entry and exit references.
4. What are the risks of relying solely on chart patterns without other indicators?
The main risk is false breakouts, which can lead to poor trading decisions.
References
- Stock Patterns: Introduction to Technical Analysis, Investopedia, accessed on 10 March 2022.
- Crypto Chart Patterns | Automated Signals, Altfins, accessed on 10 March 2022.
- Richard Knight, Crypto Chart Patterns (Cheat Sheet), DataDrivenInvestor, accessed on 10 March 2022.
- 5 Crypto Chart Patterns For Crypto Trading, Zen Ledger, accessed on 11 March 2022.
- Chart Patterns for Crypto Trading. Trading Patterns Explained, Good Crypto, accessed on 11 March 2022.
- Crypto Trading 101: Simple Charting Patterns Explained, Coin Desk, accessed on 14 March 2022.
- 5.4: Technical Analysis: Chart Patterns, Trading Crypto Course, accessed on 14 March 2022.
- Ollie Leech, 3 Crypto Chart Patterns to Help Make Sense of the Market, Coin Desk, accessed on 18 March 2022.
Share
Next Article
Investing and trading require a clear understanding of the various aspects of the coin or stock that you want to buy. One of the ways to determine the value and trend of an asset is by using technical analysis. So, what is technical analysis? Why is it so important to choose a crypto asset? This […]