Market Analysis 17-23 October 2022: EU Inflation, Bitcoin Volatility, and ETH Stagnant

In the past week, many have started to say that the crypto market is dull because there is no significant price movement. This is in stark contrast to last week when BTC experience a drastic (short-lived) decline due to the release of US inflation data. This crypto market analysis will provide you with various data regarding the movement of the crypto market. This data can help you see the meaning behind the movement of BTC and ETH over the past week. Apart from that, there are several important news from the crypto market that you should know about. Always remember that the goal of this weekly Market Analysis is to provide information and education, not financial advice.
block-heading joli-heading" id="market-analysis-summary">Market Analysis Summary
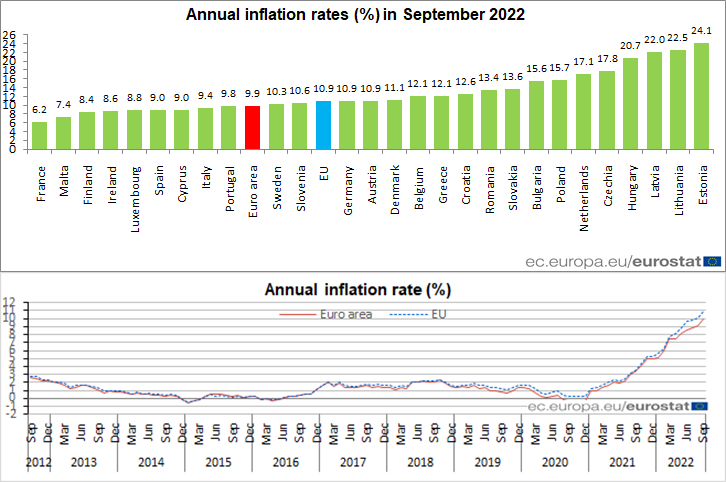
- 📈 The EU Consumer Price Index is at its highest level in 40 years, 9.9% in September.
- ⚠️ Previously, the 300-week MA was the bottom of the market in March 2020. The 300-week MA is currently at $17.5k. We may be near the bottom of a bear market cycle.
- 🧠 ETH is still in a sideways mode with the possibility of a dead cat’s bounce pattern occurring.
- 🤟 BTC currently has a lower volatility ratio than NASDAQ for the first time since 2020.
- ⚖️ Several technical indicators show that the crypto market has bottomed out or is near the bottom: NUPL, Pi-Cycle, and Market cap to Thermocap ratio.
Macroeconomy Analysis
The EU Consumer Price Index is at its highest level in 40 years, rising to 9.9% in September from 9.1% in August. Investors worry that the eurozone is at risk of a financial crisis. Although inflation affects almost all countries, European countries face the worst. Some observers blamed the US for its alleged involvement in Nord Stream sabotage, which increased EU energy inflation.
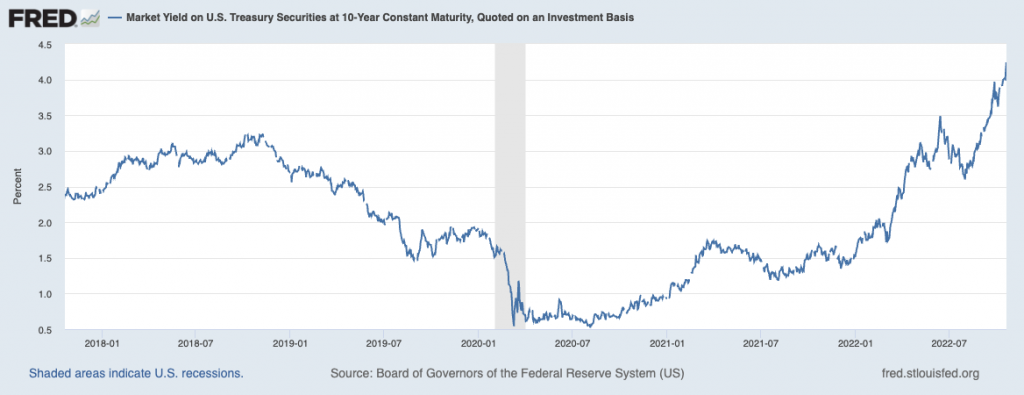
On Friday, the yield on the 10-year US Treasury rose to a 14-year high, touching 4.3% for the first time since 2008. However, it fell again after news that some Fed officials were concerned about over-tightening with rate hikes.
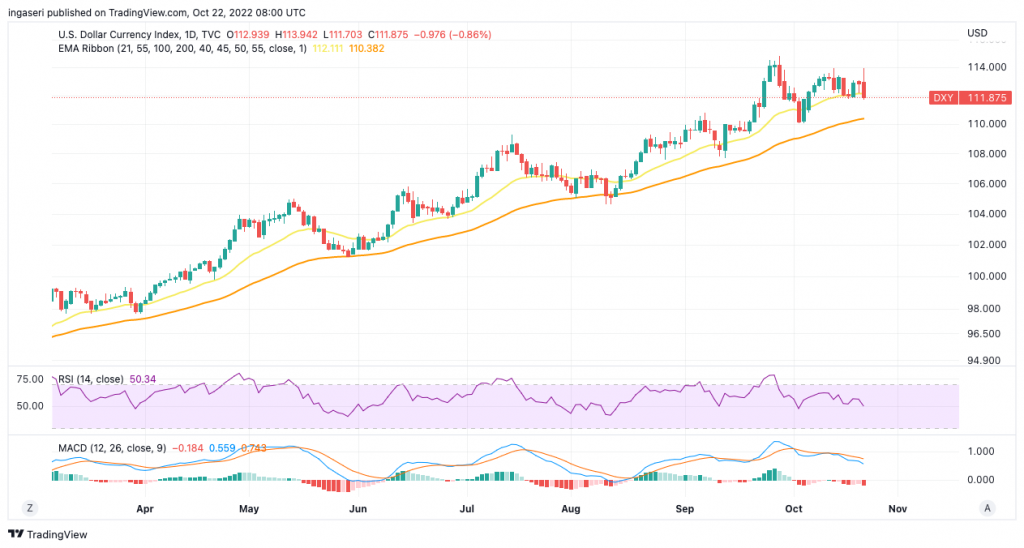
The US Dollar strength index also continued to rise, the highest level since 20 years ago. Although it had risen to the point of 114, now it is stable at 111.
bitcoin-price-movement-17-23-october-2022">Bitcoin Price Movement 17-23 October 2022
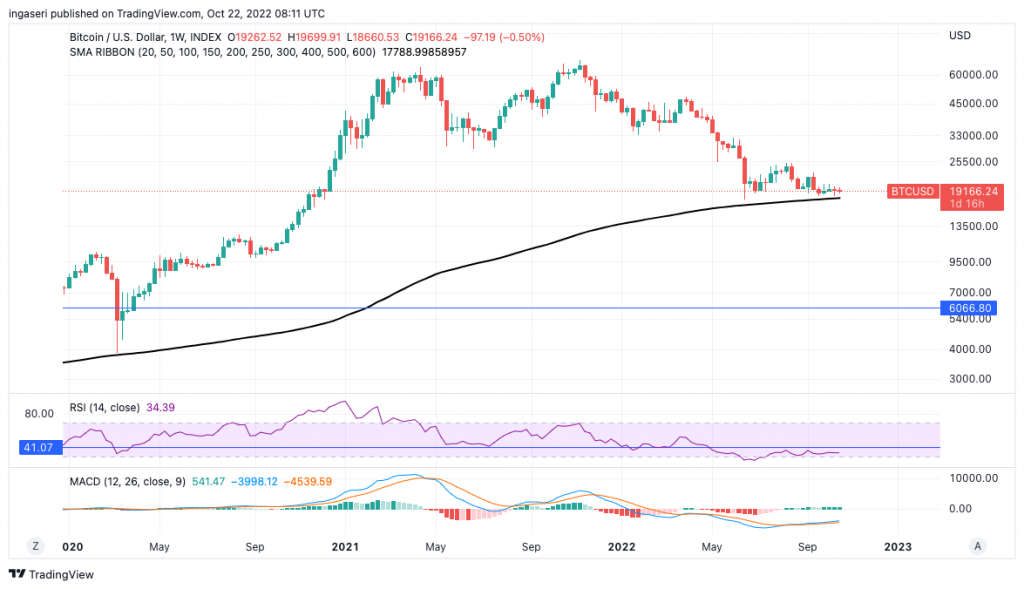
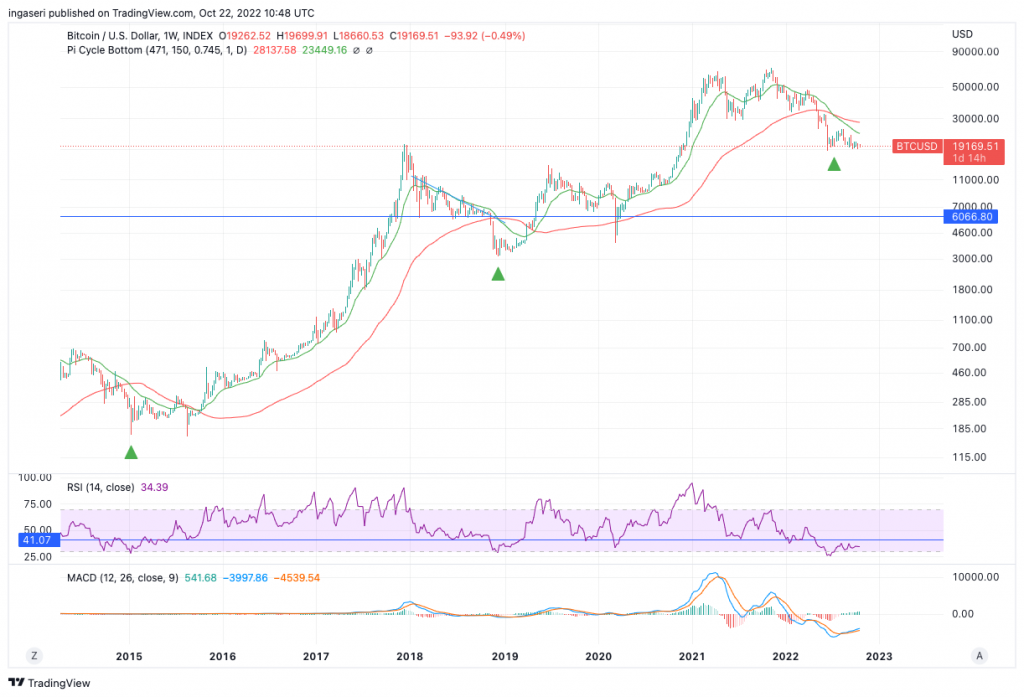
While October is usually a strong month for Bitcoin, BTC is currently in the $19k range and is likely to print red in the weekly chart. On the monthly chart, BTC is down 1,3%. We can also see that BTC is still below the 50-week MA. Last month. price was rejected at support which has turned into strong resistance.
💡 A resistance can turn into support and vice versa. In a downtrend, the support will turn into resistance before the price can go back up. In an uptrend, resistance will turn into support.
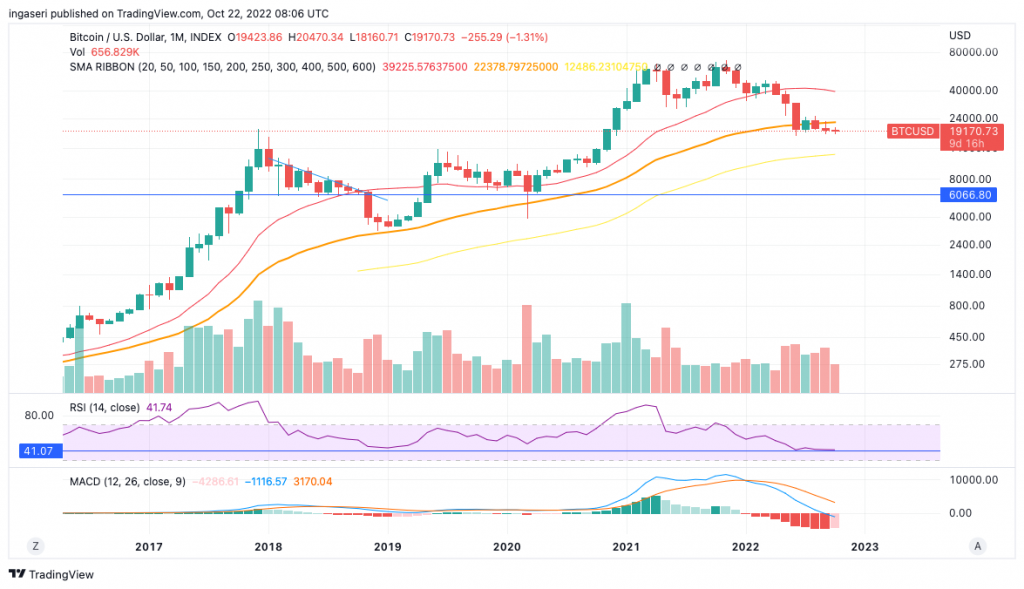
On the weekly chart, notice that we have almost bottomed out on the support line of the 300-week MA. This support signals the bottom of the market in March 2020. Now, it is currently at $17.5k. We may be around the bottom of a bear market cycle.
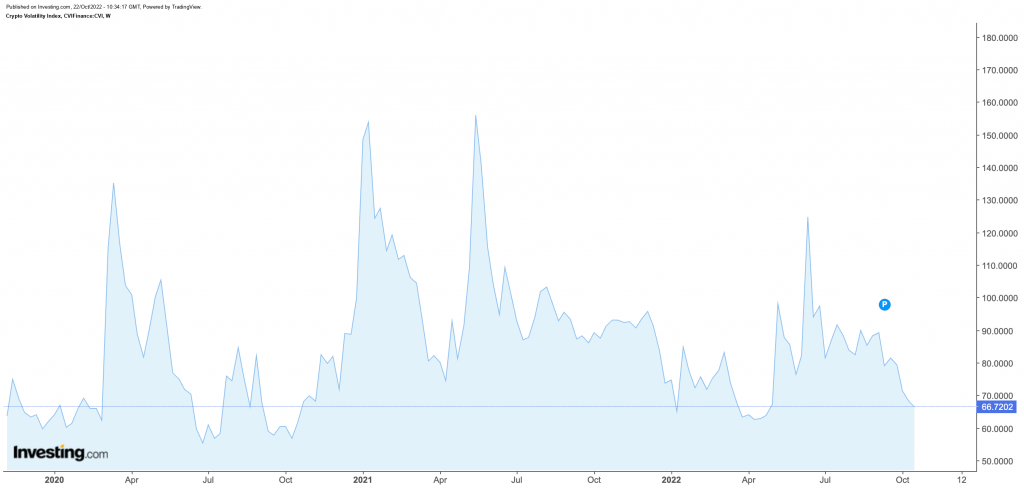
According to the crypto Volatility Index below, crypto volatility is on the decline, hitting the 66.7 mark since May earlier this year (at 62), shortly before the LUNA crash. BTC is now less volatile than the NASDAQ for the first time since 2020. The uncertainty in global markets has devastated equity markets. Moreover, the Fed’s Quantitative Tightening has also caused interest rates to spike to new highs, making the capital markets more volatile than ever before.
Ethereum Price Movement 17-23 October 2022
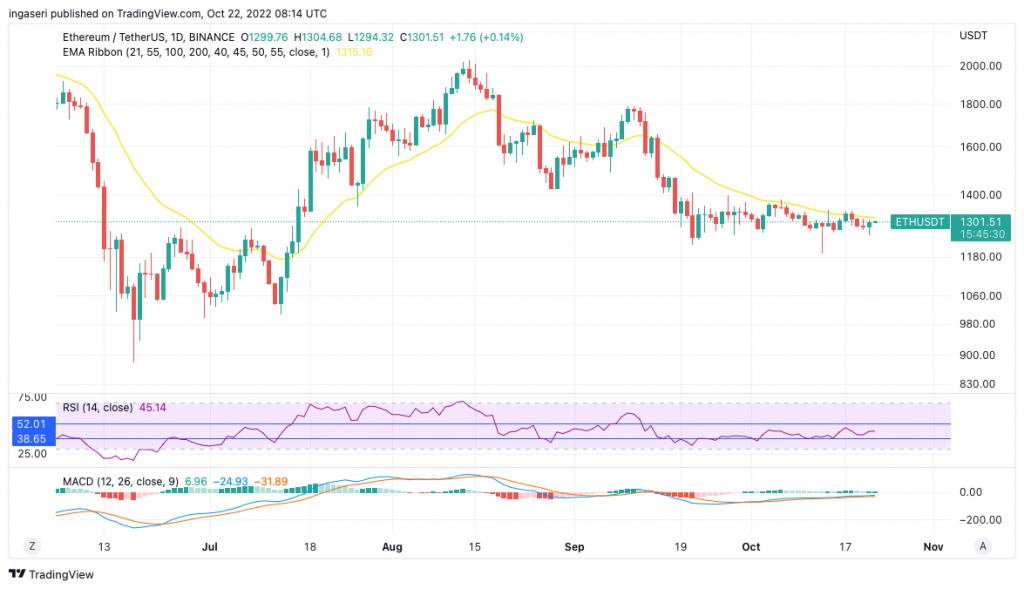
So far this week, ETH has remained sideways, with resistance at 1320 in line with the 21-week EMA line. If we close the chart above this line, we may see a dead cat’s bounce pattern in the ETH price.
💡 A dead cat’s bounce is a pattern in a downward trend (downtrend) where the price of an asset experiences a short-term rally before resuming its downward trend.
Has The Market Bottomed?
To answer the question above, let’s review some indicators again.
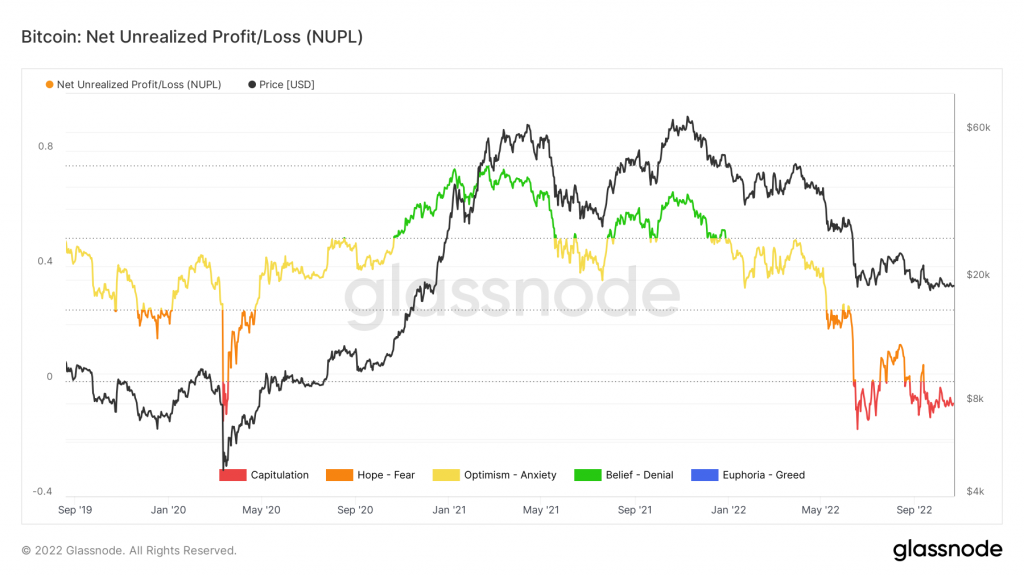
NUPL or Unrealized Net Profit/Loss is the difference between the relative unrealized gain and the relative unrealized loss. We are now (since mid-September) in capitulation mode, usually indicating a bottomed market.
The Pi cycle bottom indicator consists of the 471-day MA and 150-day EMA. Next, the 471-day MA is multiplied by 0.745 and the result is compared to the 150-day EMA to predict market bottoms. Historically, the Pi-Cycle bottom indicator has shown a bear market bottom for BTC within 3 days since this indicator flashed. Notice in the chart below that we have bottomed out the Pi-Cycle in July 2022.
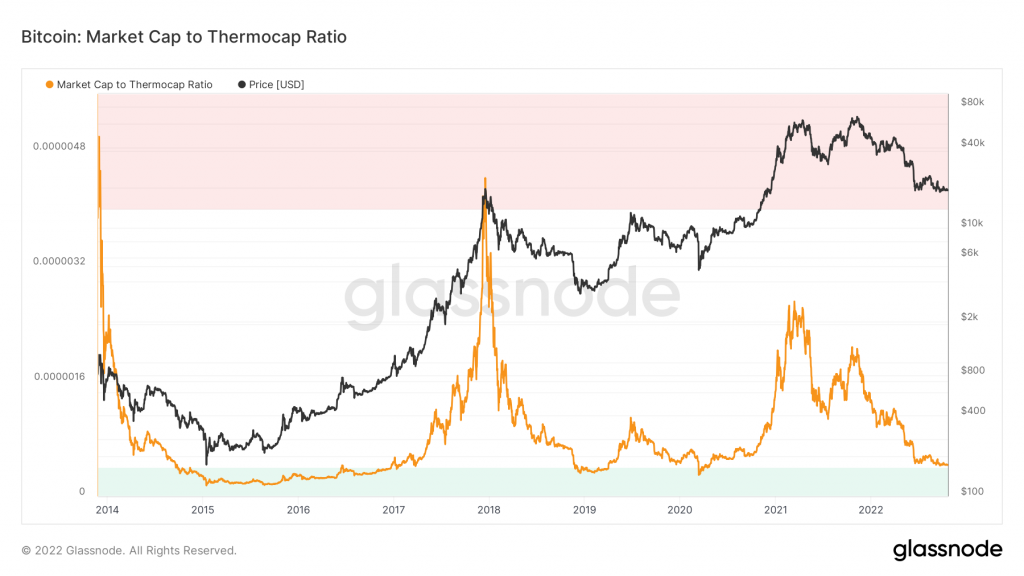
The Market cap to Thermocap ratio indicator is used to assess whether the price of an asset is currently trading at a premium in relation to the security costs incurred by miners. This ratio is adjusted to account for the increase in circulating supply. The Thermocap multiple shows the ratio between the total BTC mined (block subsidy) denominated in US Dollars, from the first day to the given day. Even though we haven’t reached the green zone yet, we are getting closer to it. When this happens, it can indicate the bottom of the market.
On-Chain Analysis
- 📊 Exchanges: Exchange reserves continuing to fall, this signals less selling pressure. Additionally, net deposits on exchanges are high when compared to the 7-day average. Higher deposits can be interpreted as higher selling pressure.
- 💻 Miners: Miners sell fewer holdings than the average one year. Miners’ earnings are on the moderate to one-year average.
- 🔗 On-chain: More investors are selling at a loss. In the middle of a bear market, it can indicate a market bottom. The movement of long-term holders in the last 7 days was lower than average. They have a motive for holding their coins. Furthermore, investors are in a capitulation phase where they are currently facing unrealized losses. This indicates a decrease in the motive to realize losses which leads to a decrease in selling pressure.
- 🏦 Derivatives Market: Traders in long positions are dominant and willing to pay short traders. Buying sentiment is dominant in the derivatives market. More buy orders are filled by takers.
Altcoin News
- 🥞 PancakeSwap Going Multichain: PancakeSwap has just pitched its expansion proposal to the Aptos network. As explained in the roadmap, This is PancakeSwap’s first step towards becoming a multichain Dapp.
- 💍NFT LOTR Ethereum: Warner Bros. has just launched the NFT for Lord of the Ring: Fellowship of The Ring in Ethereum standard format. This NFT contains LOTR movies in 4K format, additional footage, behind-the-scenes, and an AR (augmented reality) collectible. This NFT is created by Eluvio via the Content Fabric blockchain. Moreover, Content Fabric stores not only its token data in the blockchain but its film assets as well. This is the first NFT film from Warner Bros.
More News from Crypto World in the Last Week
- 🌐Aptos Launch Controversies: On October 19, 2022, Aptos, a new generation layer-1 blockchain, successfully launched the mainnet. The launch of this mainnet did not escape controversy and negative responses from the crypto community. Some of these are information on tokenomics that is hard to find, a token distribution that heavily focuses on institutional investors, and TPS which is far from its pre-mainnet promise. Mo Shaikh, CEO of Aptos, then responded to some of these things.
- 🇪🇺 EU Report on DeFi: The European Commission has just released a report on the DeFi industry. This report shows that the EU sentiment is quite positive towards DeFi. The report explained that the DeFi industry is different from conventional financial sector and cannot be regulated in the same way. In addition, it also explained the need to regulate companies and traditional entities that are trying to enter the DeFi industry.
- ⬇️ Gavin Wood Steps Down from Polkadot CEO: Gavin Wood, the co-founder of Ethereum and Polkadot, announced that he will step down from the position of CEO at Parity (the company that developed Polkadot). Gavin will move to become the more technical Chief Architect. Gavin will be replaced by Bjorn Wagner.
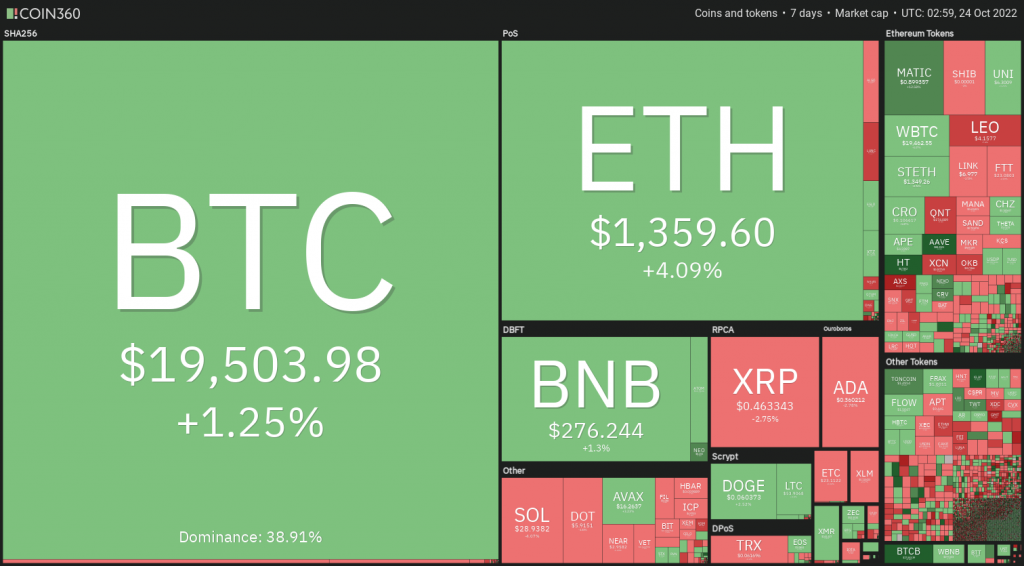
Cryptocurrencies Market Price Over the Past Week
Cryptocurrencies With the Best Performance
- AAVE (AAVE) +16,74%
- Lido DAO (LDO) +11,93%
- Polygon (MATIC) +11,81%
- Curve Finance (CRV) +10,61%
Cryptocurrencies With the Worst Performance
- Axie Infinity (AXS) -19,58%
- Ethereum Name Service (ENS) -13,96%
- Quant Network (QNT) – 10,58%
References
- Roadmap – PancakeSwap, accessed on 24 October 2022.
- Kate Irwin, Warner Bros Releases Ethereum-Compatible ‘Lord of the Rings’ NFTs, Decrypt, accessed on 24 October 2022.
- Jason Nelson, Aptos Blockchain Launches to Concerns Over Tokenomics, Decrypt, accessed on 24 October 2022.
- Aleksandar Gilbert, EU Report on Crypto Regulations Draws Praise From Crypto Attorneys, The Defiant, accessed on 24 October 2022.
- Camila Russo, Polkadot, Ethereum Co-Founder Gavin Wood Leaves Parity CEO Role, The Defiant, accessed on 24 October 2022.
Share