Market Analysis Nov 7-13: Amidst Crypto Market Turmoil, Bitcoin Saw Significant Drop

Analisis Pasar 7-13 November
The lower CPI data in October apparently did not have much of an impact on the cryptocurrency market. The FTX meltdown have brought the crypto market into the red zone.
Pintu’s team of traders has collected various important data about the movement of the crypto market over the past week, which is summarized in this Market Analysis. However, you should note that all the information in this Market Analysis is for educational purposes, not financial advice.
Market Analysis Summary
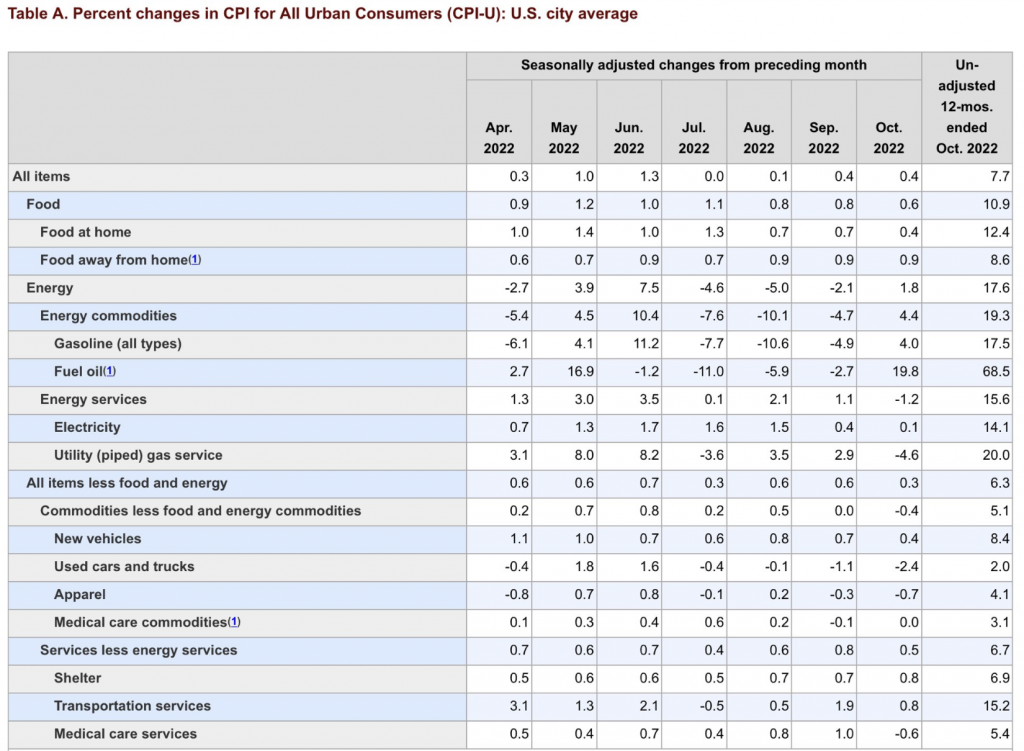
- ⚠︠ The Consumer Price Index (CPI) in the United States increased 7.7% in October, much lower than the consensus forecast of 7.9% and the September data of 8.2%.
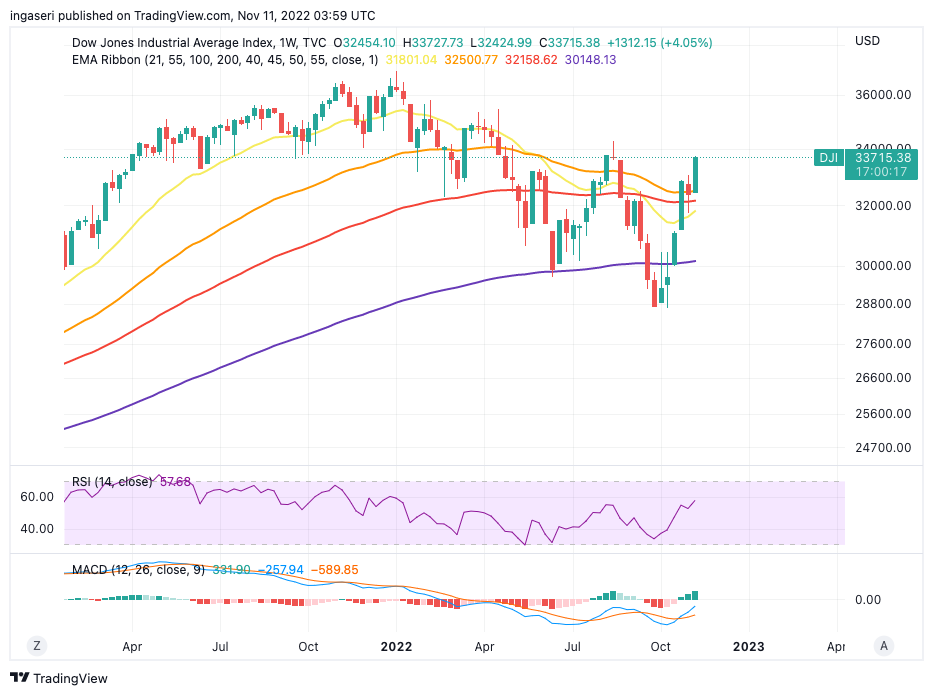
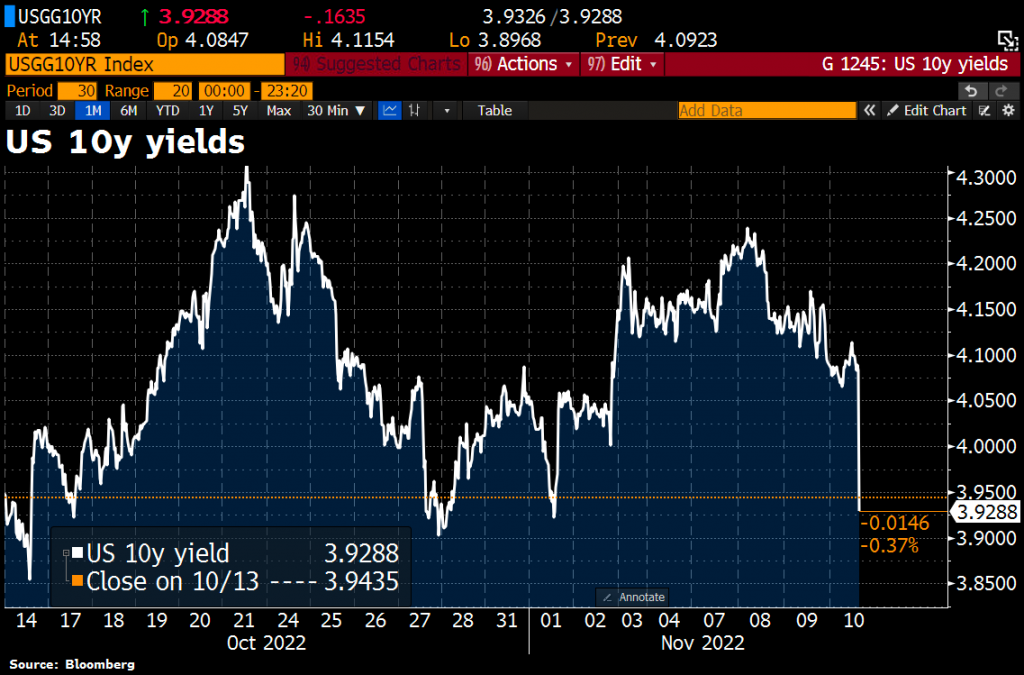
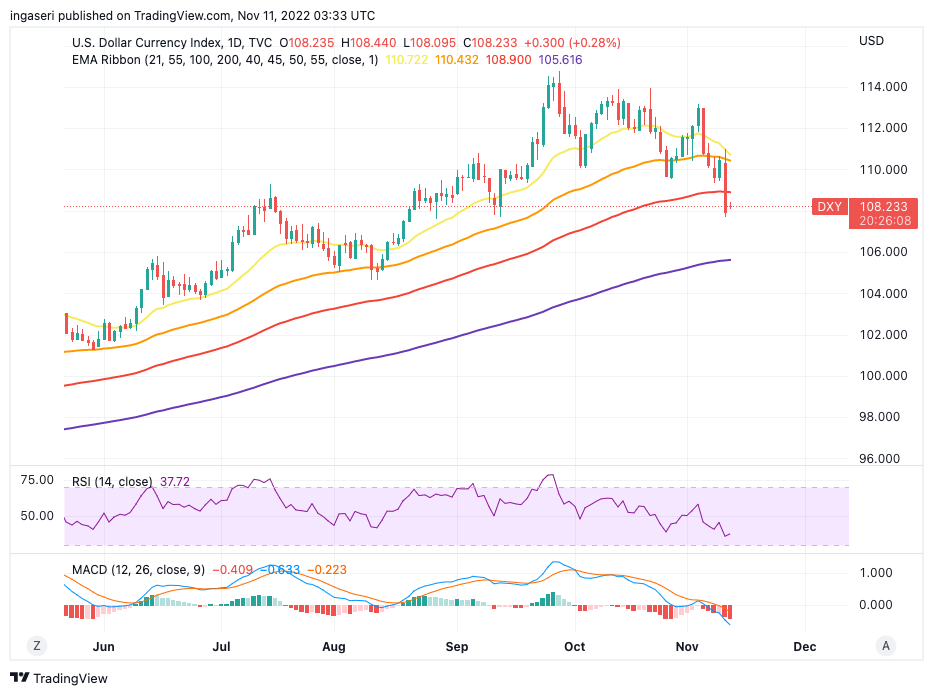
- 📊 The equity market rallied while the dollar and US Treasury yield fell after the release of the CPI data.
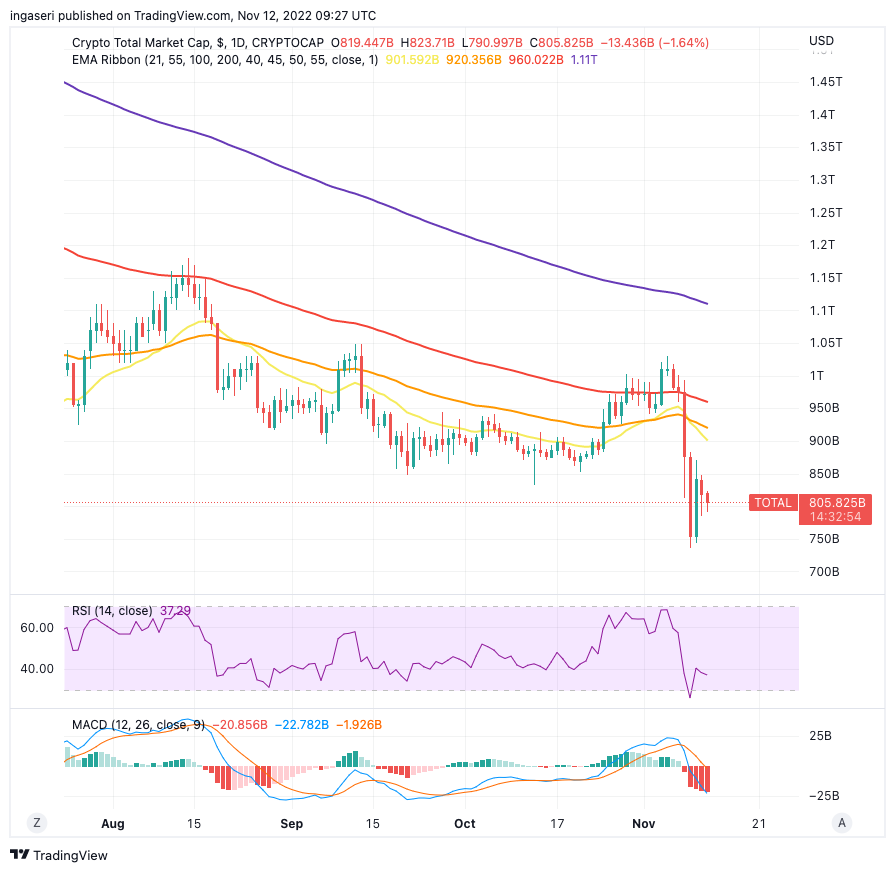
- 🚨 Unfortunately, due to the FTX turmoil, the crypto market is under great pressure. Total crypto market plunging by 18% over the week.
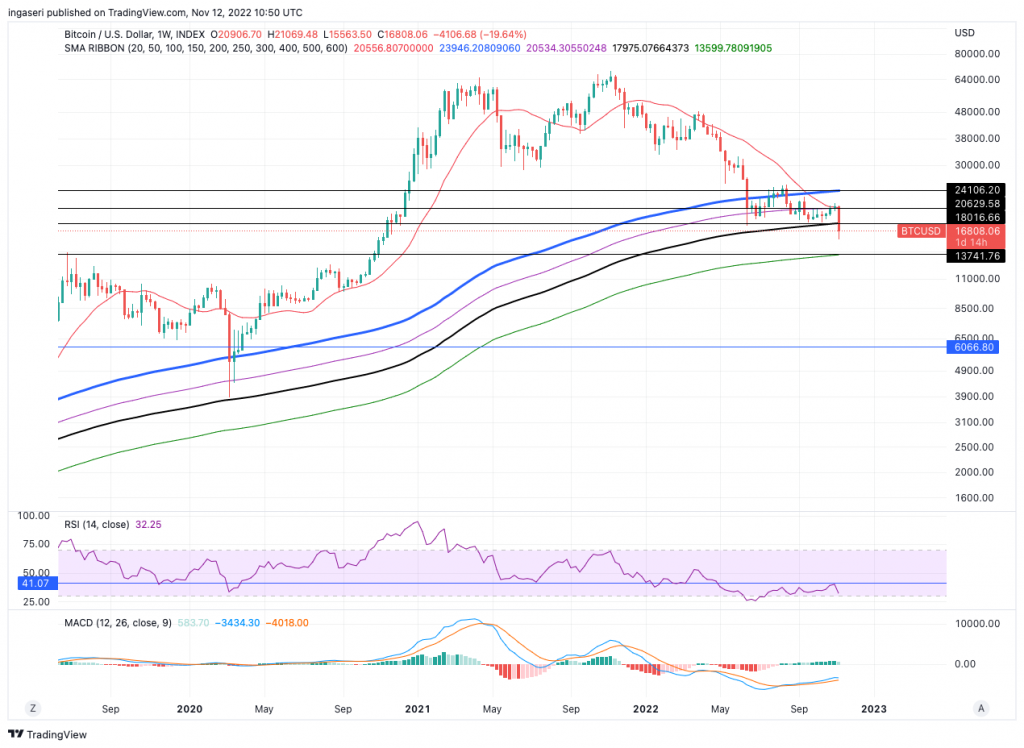
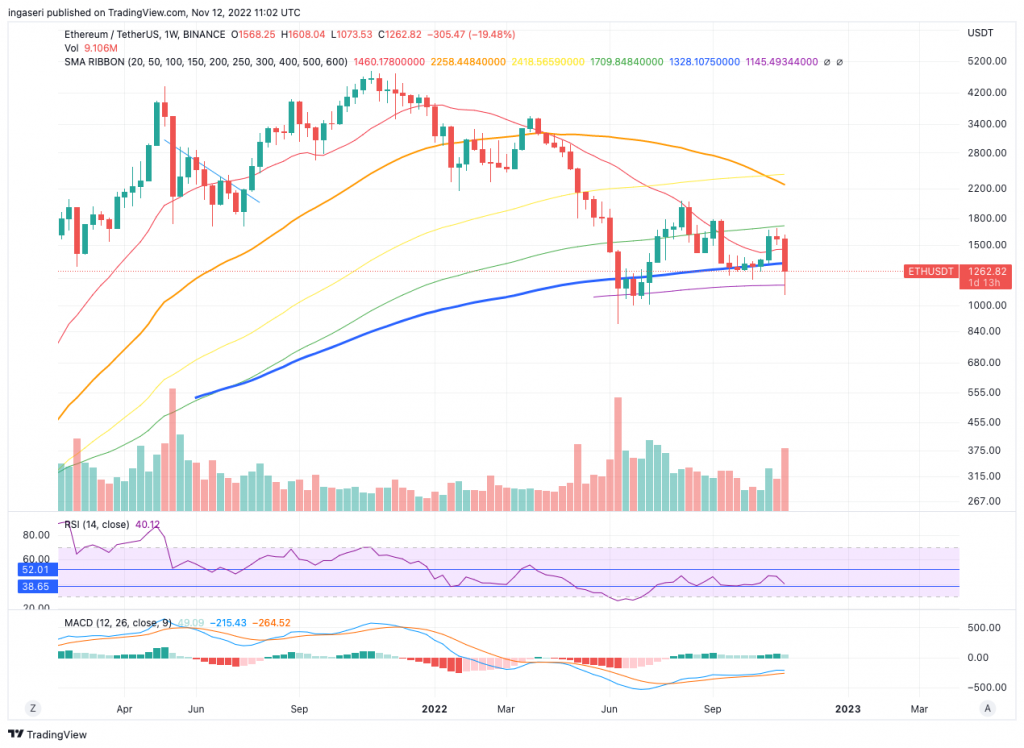
- 📉 This is the first week that BTC has fallen below the 300 weeks SMA. Meanwhile, ETH has also fallen below the 200 weeks SMA.
Macroeconomy Analysis
The equity market rallied and the dollar fell after the release of CPI by the US Bureau of Labor Statistics. The rate of 7.7% is lower than the consensus of 7.9% and below September’s reading of 8.2%. Core CPI increased 0.3% for the month, 6.3% on an annual basis, lower than expected consensus 0.5% and 6.5% respectively. The labor department also showed the jobless claims rose to 225,000 last week, this is an increase of 7,000 from last week. We have to remind ourselves this is one data point, and it does not make a trend yet. We have yet to see a confluence and consistent set of datas to confirm a complete reversal of the inflation and economy cooling down.
Dow Jones soared 1,200 points, along with S&P 500 and Nasdaq. Core price gains were lower than expected, treasury yields and dollar plunged. Market is taking these indicators as a sign that Fed might raise rates less aggressively in December.
The 10 and 2 year treasury yield post biggest daily drops in over a decade after CPI data release.
DXY fell to break down below the 100 days EMA following the release of CPI data. We have yet to see more confluence of indicators stating the economy is cooling down before we can see consistent downtrend of the dollar index.
Bitcoin Price Movement 7-13 November
It has been a very turbulent week for crypto, with the news of FTX unable to serve client’s mass withdrawals as the main reason the whole crypto market is in bloodbath. FTX’s fall from grace has caused huge ripples across the market. Total crypto market cap fell 18% Week-on-week, both BTC and ETH lost 20% of its value, with alt-coins facing higher loss. Binance then seeming come to FTX’s rescue by signing an LOI to acquire FTX but pulled out of the deal after conducting due diligence. FTX then filed for a voluntary Chapter 11 Bankruptcy with the US after failing to honor customer withdrawals and revealing a multi-billion liquidity hole. And as if things couldn’t get any worse, on Sunday over $1 Billion of customer funds are missing from FTX. A hack purportedly happened where wallets were drained and malware is found in its mobile app’s update. FTX customers are reporting account balance going to zero.
Chart below shows the total crypto market plunging by 18% over the week.
We have yet to see how widespread this contagion is, usually it will take a while before the dust settles. By then, expect more transparency from the affected venues that has exposure to the FTX debacle (both directly and indirectly). One thing is sure, there will be harsher regulatory reforms, which will dampen crypto growth in short term, but eventually be beneficial to bring trust and confidence back to the crypto market.
Historically, this is the first week that BTC has fallen below the 300 weeks SMA. In the previous bull run, we wicked down and tested below the 200 weeks SMA for a maximum of 2 weeks, before going above it to find support. This time round, we went below the (black) line. Next support is at 14,000. Resistance at 20,600 and 24,000.
Also notice how the RSI got rejected at the historically important value of 41. At this stage of fud and fear, BTC is definitely in the oversold territory:
Ethereum Price Movement 7-13 November
ETH has also fallen below the 200 weeks SMA once again, after breaking out from it mid year and finding strong support for this support line (for 5 weeks). An important factor here to see is the RSI support of 38. We have been holding this RSI line as support since May this year. Breaking this RSI support line would mean significant price fall.
On-Chain Analysis
Let’s look at the NUPL of BTC. Net Unrealized Profit/Loss is the difference between Relative Unrealized Profit and Relative Unrealized Loss. We are currently at market capitulation, which historically represents a good buying opportunity in the long term.
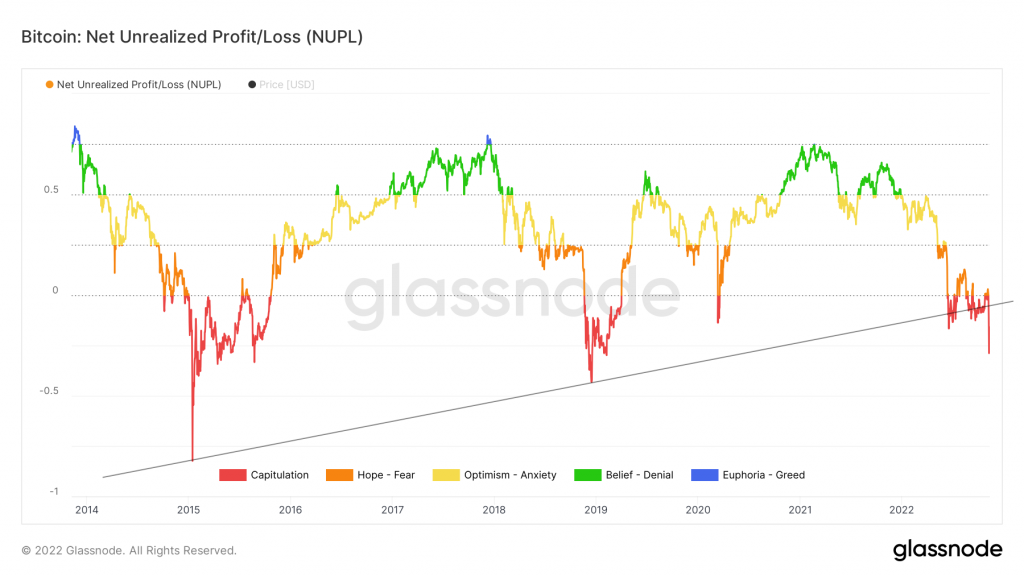 Bitcoin at market capitulation phase" class="wp-image-6252" srcset="https://pintu-academy.pintukripto.com/wp-content/uploads/2022/11/NUPL-1-1024x576.png 1024w, https://pintu-academy.pintukripto.com/wp-content/uploads/2022/11/NUPL-1-300x169.png 300w, https://pintu-academy.pintukripto.com/wp-content/uploads/2022/11/NUPL-1-768x432.png 768w, https://pintu-academy.pintukripto.com/wp-content/uploads/2022/11/NUPL-1-1536x864.png 1536w, https://pintu-academy.pintukripto.com/wp-content/uploads/2022/11/NUPL-1-1200x675.png 1200w, https://pintu-academy.pintukripto.com/wp-content/uploads/2022/11/NUPL-1.png 1800w" sizes="(max-width: 1024px) 100vw, 1024px">
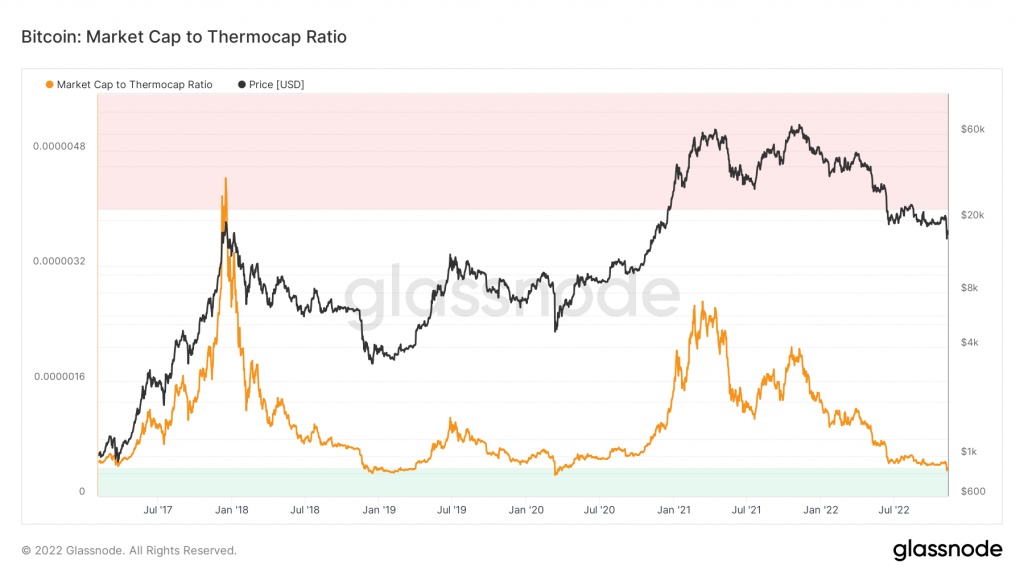
The Market Cap to Thermocap Ratio is simply defined as Market cap / Thermocap, and can be used to assess if the asset’s price is currently trading at a premium with respect to total security spend by miners. The ratio is adjusted to account for the increasing circulating supply over time. Notice that for the first time since Mar 2020, we are finally are the green zone. Historically, values below 0.0000004 (highlighted in green) marked market cycle bottoms. Conversely, values above 0.000004 (highlighted in red) marked cycle tops.
On-chain Analysis:
📊 Exchange: As the exchange reserve continues to fall, it indicates lower selling pressure. Net deposits on exchanges are high compared to the 7-day average. Higher deposits can be interpreted as higher sellin g pressure.
💻 Miner: Miners’ are selling more holdings compared to its one-year average. Miner’s revenue is in a moderate range, compared to its one-year average.
🔗 On-chain: More investors are selling at a loss. In the middle of a bear market, it can indicate a market bottom. Long term holders’ movement in the last 7days were higher than the average. If they were moved for the purpose of selling, it may have negative impact. Investors are in a capitulation phase where they are currently facing unrealized losses. It indicates the decreasing motive to realize loss which leads to a decrease in sell pressure.
🏦 Derivatives: Short position traders are dominant and are willing to pay long traders. Buying sentiment is dominant in the derivatives market. More buy orders are filled by takers. As open interest decreases, it indicates investors are closing futures positions and possibility of trend reversals. In turn, this might trigger the possibility of long/short-squeeze caused by sudden price movement or vice versa.
Altcoin News
- Ether officially turns deflationary amid intense crypto-market fear. 55 days after The Merge, Ether officially turned deflationary. The post-Merge supply of ether has declined by over 400 ETH ($469,000), as of 5:35 a.m. ET. Ethereum’s deflation rate is currently 0.001% annually. Were the Merge never to have taken place, the total supply of ether would have increased by over 650,000 ETH ($762 million) with an inflation rate of nearly 3.6%
- Elrond (EGLD) rebrands as MultiversX, shifts focus to the metaverse. Elrond will move forward under the new name MultiversX. They introduce the three new metaverse-forward products. xFabric, xPortal and xWorlds as the part of rebrand, all of which aim to help metaverse creators and users. The tools include a metaverse portal, digital assets holder, creator utilities and a deployable blockchain module.
More News from Crypto World in the Last Week
- **Crypto.com accidentally sends 320k ETH to wrong users. Due to the current trend of proof-of-reserve by exchanges, Crypto.com publicly shared the list of addresses of the company’s cold storage. Turn out, Crypto.com sends 320k ETH to another exchange, Gate.io. This has led to speculation that the exchanges were assisting each other in forging asset certificates. Crypto.com claimed that the funds were subsequently returned to their cold storage. Also, Crypto.com ensure that new process and features were implemented to prevent this from reoccurring.
- MetaMask Launches Integrated Bridge Feature. MetaMask Bridges is a bridge aggregation service that allows users to transfer their assets across multiple blockchains from within the wallet. This feature has been launched in beta and is a part of the newly-launched MetaMask Portfolio dApp. With Bridges, users can bridge assets worth up to $10,000.
- OpenSea Launches First Royalty Enforcement Tool. Amid ongoing NFT royalty debate, OpenSea decided to launch royalty enforcement tool. The goal of the tool is to make creator fees, also known as royalties, enforceable on-chain, and will apply to new collections listed on the platform starting 8th November. Any collection created using the tool will be blacklisted from being resold on marketplaces that don’t enforce royalties.
Cryptocurrencies Market Price Over the Past Week
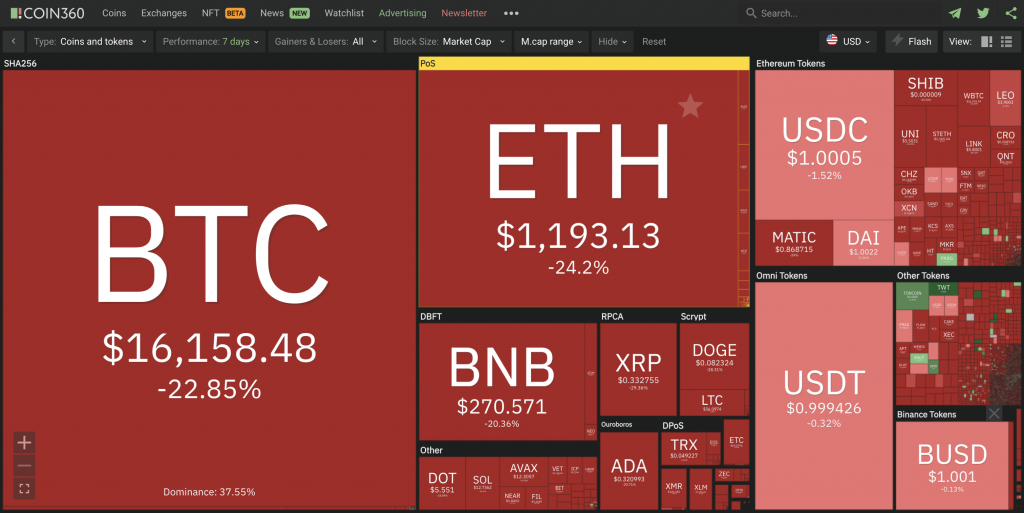
Cryptocurrencies With the Best Performance
- GMX (GMX) +5.99%
- PAX Gold (PAXG) +4.49%
Cryptocurrencies With the Worst Performance
- Solana (SOL) -60.80%
- Aptos (APT) -47.10%
- Apecoin (APE) -44.17%
- Algorand (ALGO) -41.77%
- Near Protocol (NEAR) -41.14%
Reference
- Adam James, Ether officially turns deflationary amid intense crypto-market fear, The Block, accessed on 12 November 2022.
- Savannah Fortis, Elrond rebrands as MultiversX, shifts focus to the metaverse, accessed on 12 November 2022.
- Tarang Khaitan, MetaMask Launches Integrated Bridge Feature, The Defiant, accessed on 12 November 2022.
- Eli Tan, OpenSea Launches First Royalty Enforcement Tool Amid NFT Marketplace Drama, Coin Desk, accessed on 12 November 2022.
- Arijit Sakrar, Crypto.com accidentally sends 320k ETH to Gate.io, recovers funds days after, Coin Telegraph, accessed on 13 November 2022.
Share
Related Article


See Assets in This Article
ETH Price (24 Hours)
Market Capitalization
-
Global Volume (24 Hours)
-
Circulating Supply
-