Market Analysis April 29, 2023: BTC Strengthens by 6.5%, Poised to Extend its Uptrend

In Q1 2023, US economic growth slowed down compared to Q4 2022. However, last week, the crypto market showed a positive trend with a 6.5% rise in BTC. It came after BTC held at its support line for six consecutive weeks.
Pintu’s trader team has gathered important information and analyzed the overall economic situation as well as the movement of the crypto market over the past week. However, it should be noted that all information in this Market Analysis is intended for education purposes only, not financial advice.
block-heading joli-heading" id="market-analysis-summary">Market Analysis Summary
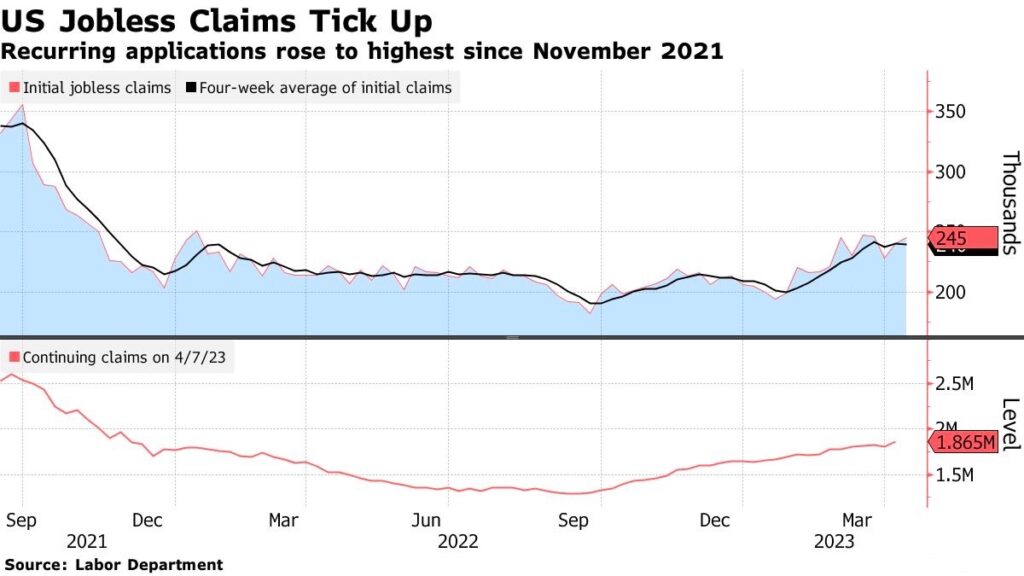
- 📉 Jobless claims in the US have decreased. Continuing jobless claims fell by 3,000 in the second week of April 2023, and initial jobless claims fell by 16,000 in the third week of April 2023.
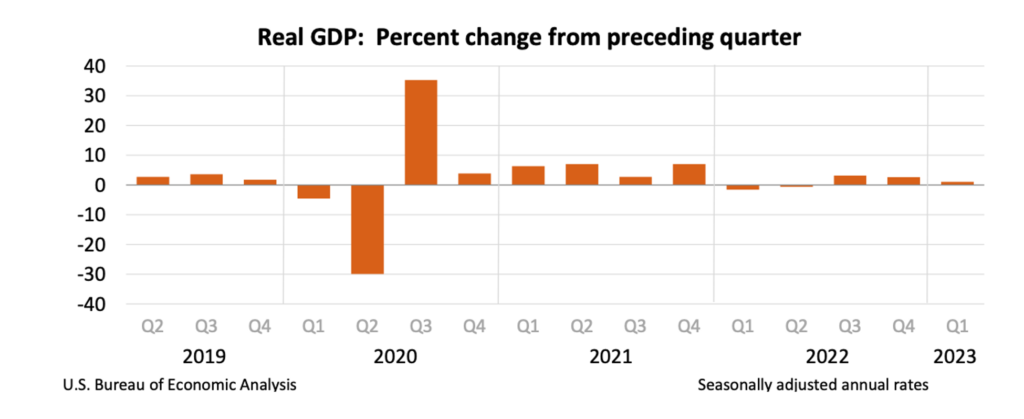
- 🐢 The US economy experienced a slower than anticipated growth in the first quarter. GDP in Q1 2023 is at 1.1%, lower than the forecast of 2%, and the growth rate in the fourth quarter of 2022 at 2.6%.
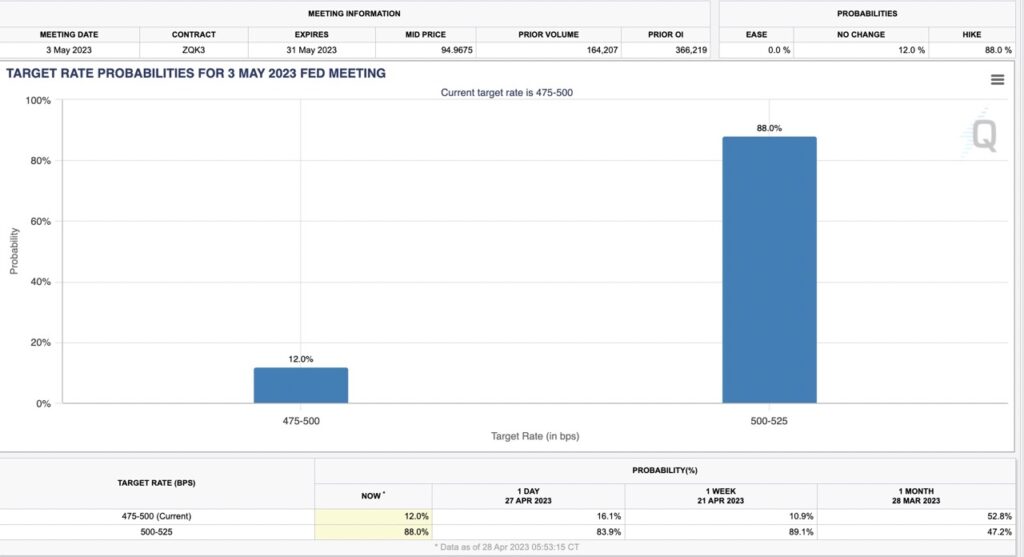
- 🏦 The Fed is expected to raise interest rates by 25 basis points in the upcoming week with a probability of 88%.
- ✨ BTC has risen 6.5% this week after falling almost 9% last week. BTC has been at this support for 6 consecutive weeks, which is a good sign for a continuation towards the upside.
Macroeconomic Analysis
According to the weekly data released by the US Department of Labor (DOL) on Thursday, the number of first-time jobless claims amounted to 230,000 for the week ending on April 22. This figure represents a decrease from the previous week’s revised number of 246,000 (previously reported as 245,000) and is lower than the market consensus of 248,000. The latest print is the lowest it has been in three weeks.
In the week ending April 15th, the number of Continuing Claims dropped by 3,000 to 1.858 million, which is lower than the market expectation of 1.878 million.
Cited from Investopedia, Continuing claims are ongoing weekly unemployment benefit claims by workers who previously filed an initial claim.
GDP growth rate QoQ increased by 1.1% vs 2% consensus vs 2.6% in the fourth quarter. The US economy experienced a slower than anticipated growth in the first quarter due to businesses liquidating their inventories in anticipation of weaker demand and higher borrowing costs later this year, despite a boost in consumer spending. However, the Commerce Department’s report on Thursday showed the first decline in private inventories in 18 months, which could be positive news for the economy in the upcoming quarter. This decrease in inventory bloat is expected to prevent a more severe economic downturn, which was a concern for some.
It is anticipated that the Fed will increase interest rates by 25 basis points in the upcoming week, with a probability of 88%. which could mark the final hike in the central bank’s quickest monetary policy tightening cycle since the 1980s. Starting from March of the previous year, the Fed has raised its policy rate by 475 basis points, transitioning from near-zero levels to the current range of 4.75%-5.00%.
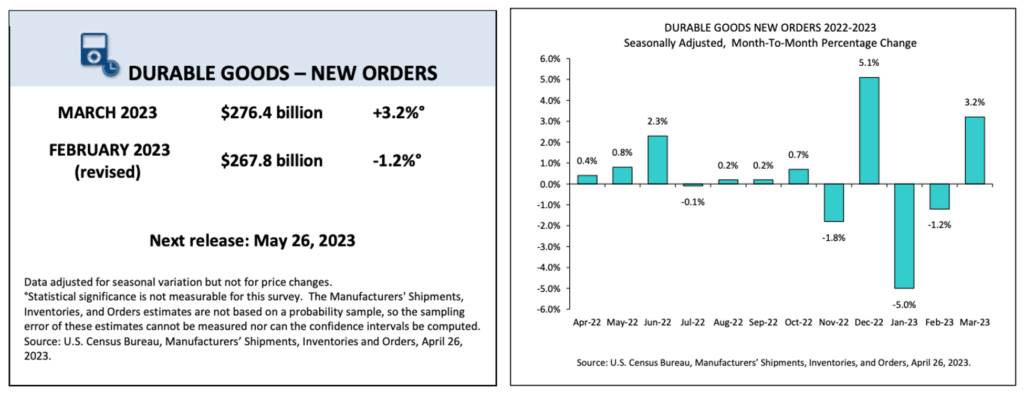
According to the US Census Bureau’s announcement on Wednesday, there was a 3.2% increase, equivalent to 8.6 billion US dollars, in Durable Goods Orders in the US for March, reaching a total of 276.4 billion US dollars. This growth comes after a 1.2% contraction in February (which was revised from -1%) and exceeded market expectations for a 0.8% increase by a significant margin. The report also notes that if transportation is excluded, new orders increased by 0.3%, and if defense is excluded, new orders increased by 3.5%. Additionally, transportation equipment, which had experienced two consecutive monthly decreases, was the driving force behind the rise, increasing by 8.1 billion US dollars or 9.1% to 97.4 billion US dollars.
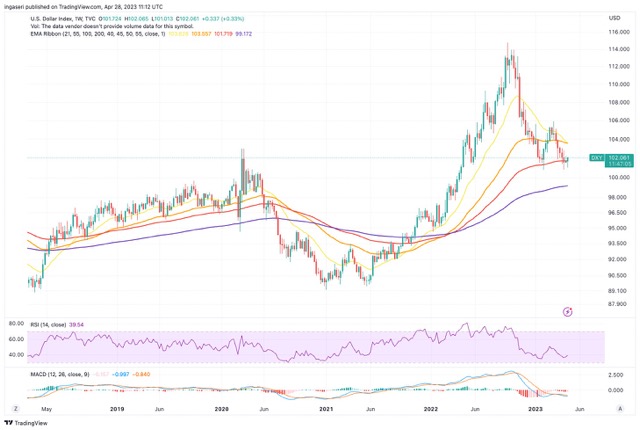
DXY has returned to its 100 weeks EMA support line after falling below its support line for a week. The greenback has been oversold since its breakdown for the past two months.
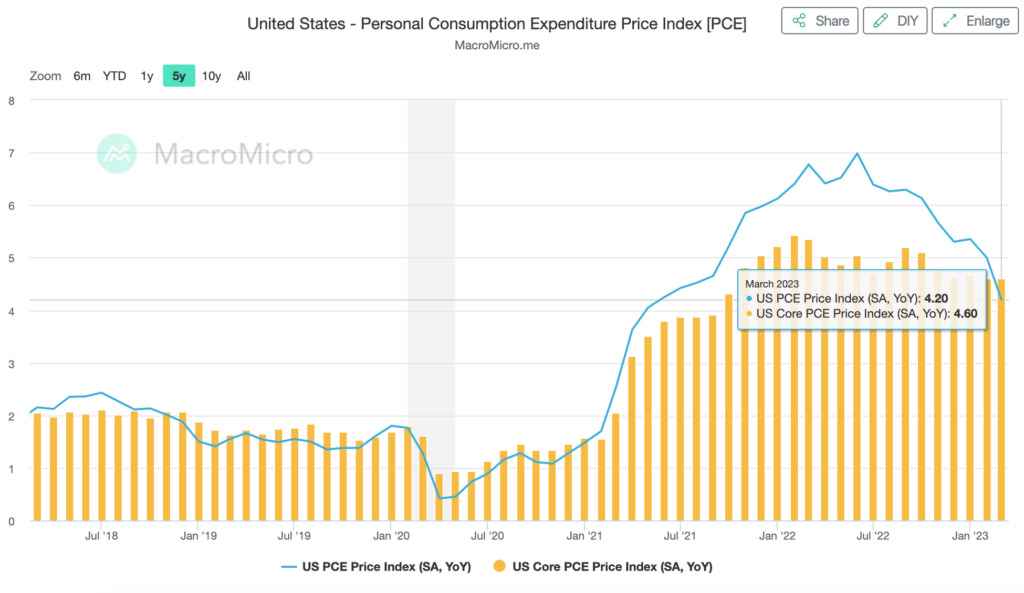
According to a report from the US Bureau of Economic Analysis on Friday, the yearly measurement of inflation in the US, as determined by the Personal Consumption Expenditures (PCE) Price Index, decreased from 5.1% in February to 4.2% in March, which was below the market’s expectation of 4.6%. In the same period, the annual Core PCE Price Index, which is the Federal Reserve’s preferred inflation indicator, also decreased slightly from 4.7% to 4.6%, contrary to analysts’ prediction of 4.5%. Additionally, PCE inflation increased by 0.1% monthly, while Core PCE inflation increased by 0.3% monthly. The report also revealed that Personal Spending remained steady in March, while Personal Income grew by 0.3%.
Crypto Analysis
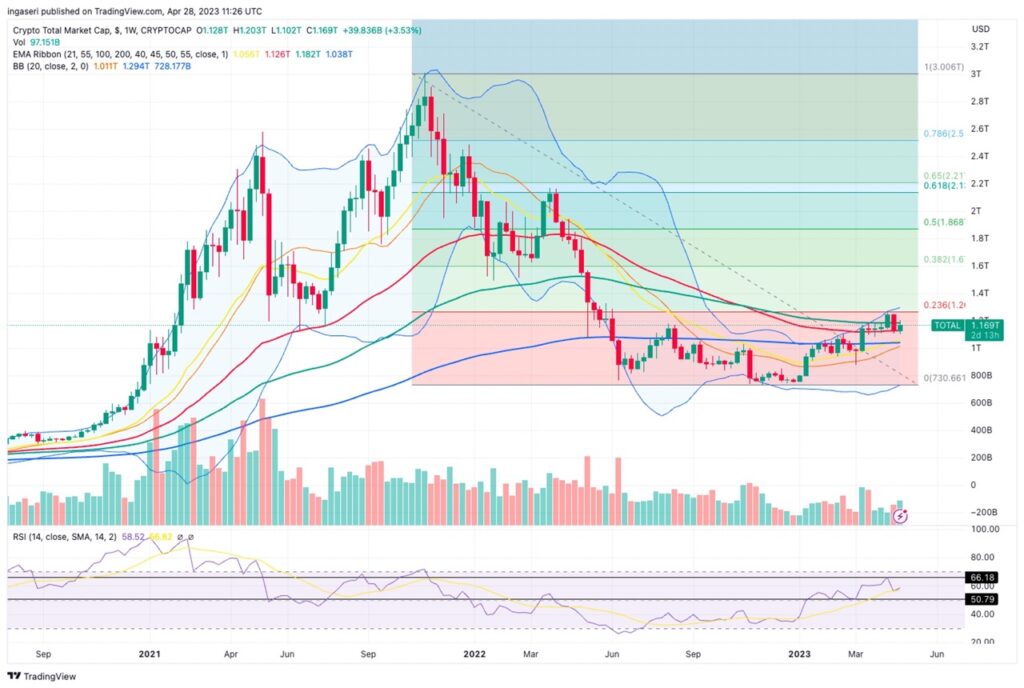
Total Crypto Market has held up on its 55 weeks EMA line after last week of breaking down to the support line.
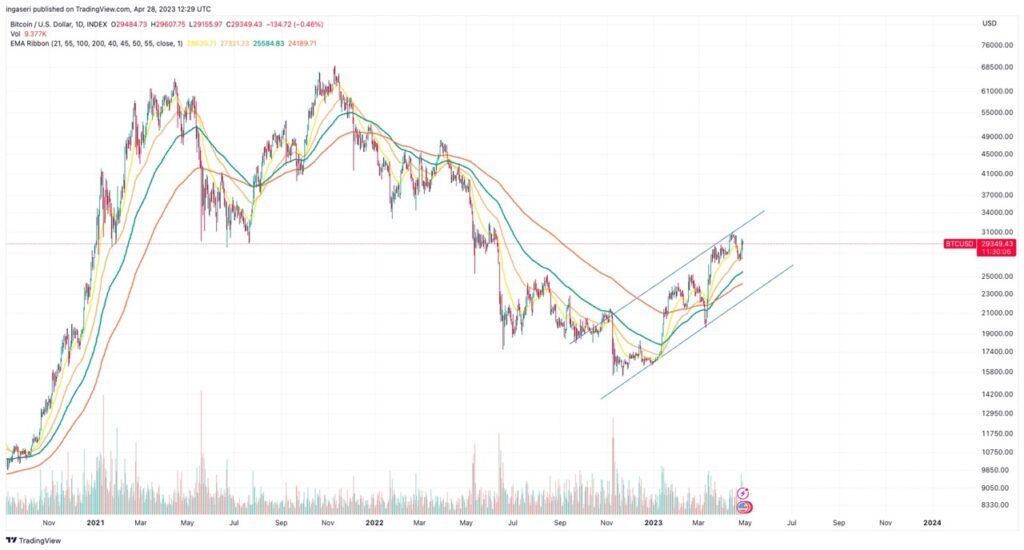
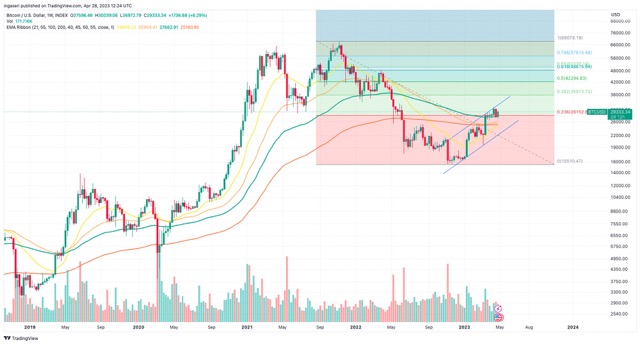
BTC has risen 6.5% this week after falling almost 9% last week. The weekly candle is at 100 weeks EMA support line. BTC has been at this support for 6 consecutive weeks, which is a good sign for a continuation towards the upside. Resistance is at the psychological price level of 30.000 US dollars.
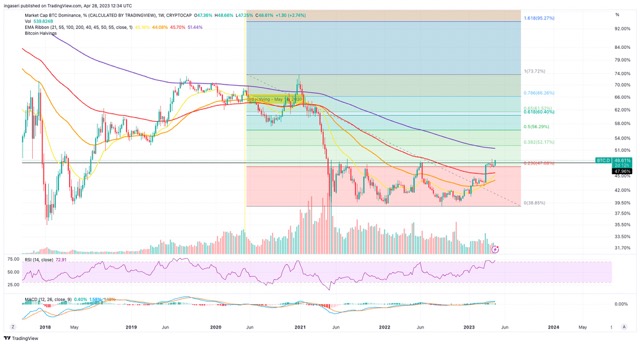
Interestingly, BTC dominance has risen above the historical support of 48%. BTC has been outperforming ETH and alts for the past 2 weeks. This increase of BTC dominance would mean that BTC will dominate the liquidity.
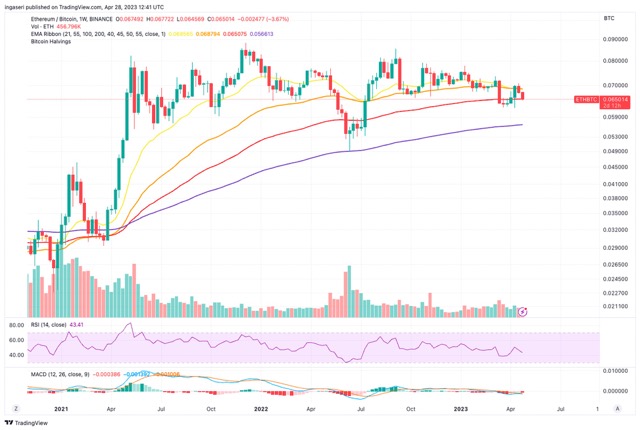
ETH/BTC chart is at 100 weeks EMA support. Should we see an increase in BTC dominance, expect a further breakdown of ETH/BTC.
On-Chain Analysis:
- 📊 Exchange: As the exchange reserve continues to rise, it indicates higher selling pressure. Net deposits on exchanges are low compared to the 7-day average. Lower deposits can be interpreted as lower selling pressure.
- 💻 Miner: Miners’ are selling holdings in a moderate range compared to its one-year average. Miner’s revenue is in a moderate range, compared to its one-year average.
- 🔗 On-Chain: More investors are selling at a profit. In the middle of a bull market, it can indicate a market top. Long term holders’ movement in the last 7days were lower than the average. They have a motive to hold their coins. Investors are in a anxiety phase where they are currently in a state of moderate unrealized profits.
- 🏦 Derivatives: Long position traders are dominant and are willing to pay to short traders. Buying sentiment is dominant in the derivatives market. More buy orders are filled by takers. As open interest decreases, it indicates investors are closing futures positions and possibility of trend reversals. In turn, this might trigger the possibility of long/short-squeeze caused by sudden price movement or vice versa.
- 🔀 Technicals: RSI indicates a neutral condition. Stochastic indicates a neutral condition where the current price is in a moderate location between the highest-lowest range of the last 2 weeks.
News about Altcoins
- Solana has become the first blockchain project to measure its carbon emissions data in real time. The Solana Foundation will regularly update a dashboard with statistics monitoring key environmental metrics for the network, including its energy consumption, carbon footprint, and network power intensity. The data is pulled from software installed on Solana validator nodes, but the dashboard is only updated every two weeks.
- On April 25, 2023, Avalanche has announced Cortina update on its mainnet. Cortina brings three key optimizations for the Avalanche network, namely X-Chain linearization, batched delegator rewards, and increased C-Chain gas limit.
Other News from the Crypto World in the Past Week
- China’s WeChat to Allow More In-app Digital Yuan (CBDC) Payments. WeChat ecosystem will let users make digital yuan payments on applets and video channels. WeChat applets are apps that integrate with the WeChat ecosystem.
- Circle launches cross-chain USDC transfer protocol for Ethereum and Avalanche. Circle, the creator of USDC, has launched a new protocol that allows users to transfer USDC between Ethereum and Avalanche without the need for a third-party bridge or Circle partner. The Cross-Chain Transfer Protocol (CCTP) enables direct transfer of USDC between the two networks, eliminating the previous complications for Avalanche users who held USDC on Ethereum.
Cryptocurrencies Market Price Over the Past Week
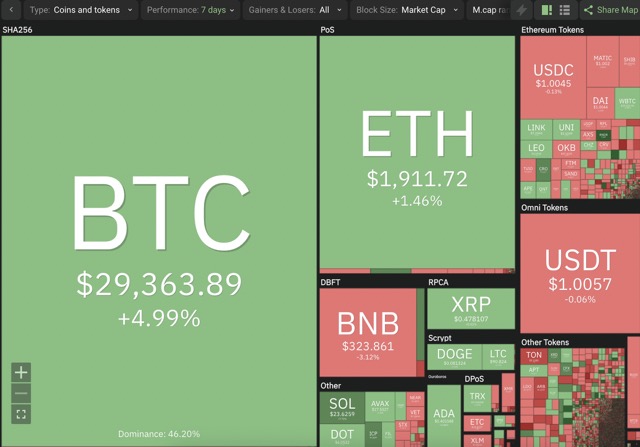
Cryptocurrencies With the Best Performance
- Injective Protocol (INJ) +8.51%
- Solana (SOL) +6.92%
- Bitcoin (BTC) +6.16%
Cryptocurrencies With the Worst Performance
- PancakeSwap (CAKE) -20.48%
- Ziliqa (ZIL) -14.03%
- 1inch Network (1INCH) -5.13%
References
- Tim Alper, China’s WeChat to Allow More In-app CBDC Payments – Digital Yuan Pilot “Accelerates”, Cryptonews, accessed 30 April 2023.
- Patrick O’Grady, Cortina: X-Chain Linearization, Medium Avalanche, accessed 30 April 2023.
- Sander Lutz, Solana Now Measures Network Carbon Emissions Data in Real Time, Decrypt, accessed 30 April 2023.
- Tom Blackstone, Circle launches cross-chain USDC transfer protocol for Ethereum, Avalanche, Cointelegraph, accessed 30 April 2023.
Share
Table of contents


