How to Find and Analyze The Bullish Divergence Pattern

Bullish divergence is a signal that the market momentum is strengthening, and that the price is likely to move upward. The presence of bullish divergence is often interpreted as buying opportunity because of the potential upward movement. To spot bullish divergence, a trader must analyze the price movement with technical indicators such as stochastic, RSI, or MACD.
However, finding a bullish divergence is complex and requires a thorough and accurate analysis. Therefore, this article will show you where to look for and how to recognize bullish divergence patterns.
Article Summary
- 🔍 Bullish divergence is a signal that shows a potential trend reversal to upward movement. There are two kinds of bullish divergence: regular bullish divergence and hidden bullish divergence.
- 👨🏻💻 Traders who manage to find the bullish divergence signal can use them to determine the right time to trade.
- 📈 Traders can use technical indicators such as stochastic oscillators, Relative Strength Index (RSI), and Moving Average Convergence Divergence (MACD) to find a bullish divergence.
- ⏳ The longer the time frame, the better it will be to find a more accurate bullish divergence signal.
What is a Bullish Divergence?
Before we talk about bullish divergence, we need to firstly understand the definition of divergence. So what is a divergence? Divergence is a market condition when the asset price moves in the opposite direction of a technical indicator. The emergence of a divergence pattern can signify whether a trend will continue, weaken, or reverse.
There are two kinds of divergence, positive divergence, and negative divergence. Positive divergence, often called bullish divergence, shows the asset price may go upward. Meanwhile, a negative divergence or a bearish divergence is the opposite.
By definition, bullish divergence is a market condition that shows the asset price is at a lower low, but at the same time, the technical indicator is at a higher low. The lower low is when the price declines, followed by another decline (lower than the previous price). Meanwhile, the higher low is a condition where the price declines, but then the price rises and is higher than the previous price.
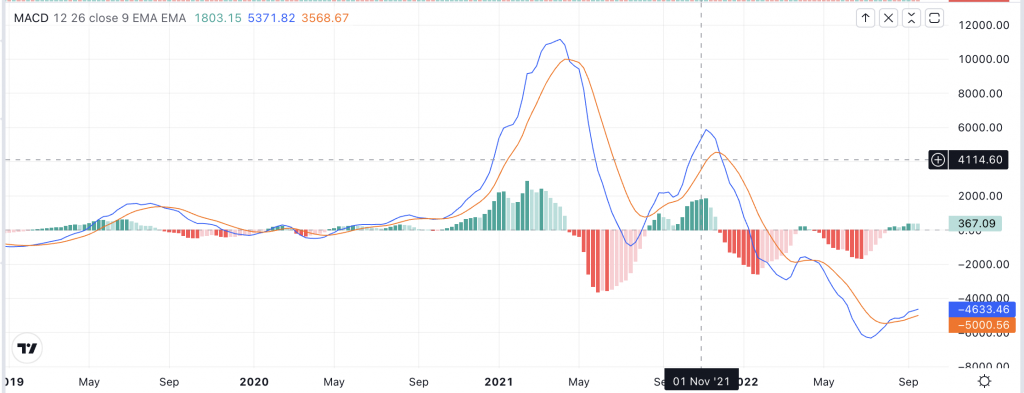
To make it easier to understand, here’s an example of a bullish divergence chart:
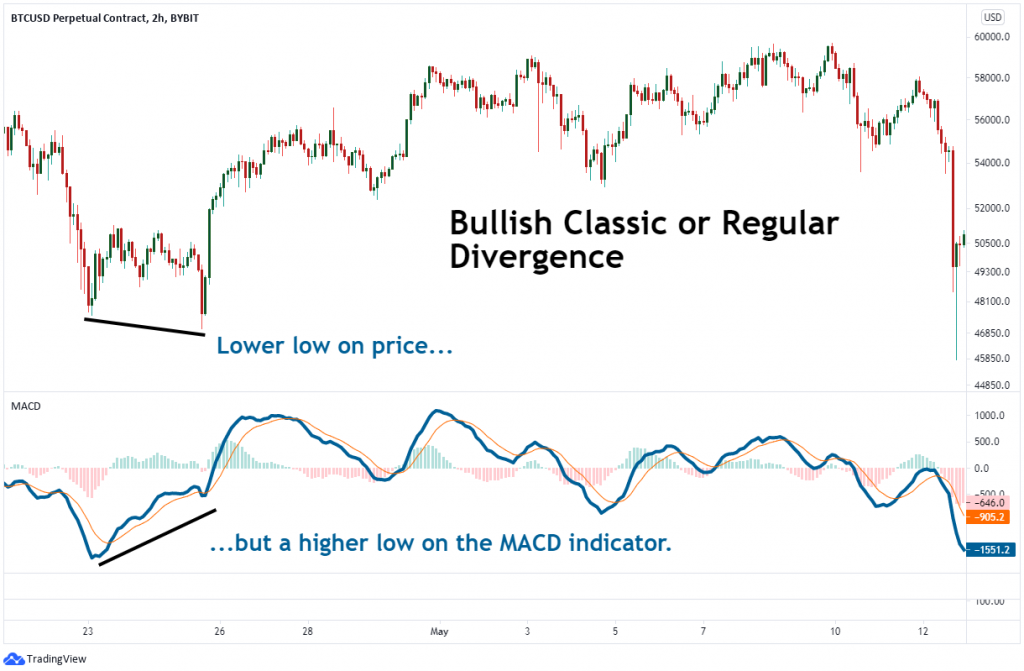
The illustration shows that the price is declining and creating a lower low. Meanwhile, the indicator chart (MACD) is moving up and at a higher low.
When a bullish divergence happens, there is an indication that the price is weakening and losing its momentum. Therefore, this pattern often signals that the price momentum will reverse and price will start to rise (bullish). You can see in the picture above where the BTC/USD experiences a bullish trend after a short correction. As a result, bullish divergence became a signal that traders have been looking for.
Bullish Divergence Pattern
There are two bullish divergence patterns, regular bullish divergence, and hidden bullish divergence.
- Regular Bullish Divergence
As mentioned earlier, a regular bullish divergence occurs when the price chart is at a lower low while the technical indicator is at a higher low. Regular bullish divergence is vital in showing a reversal signal from bearish to a bullish trend.
2. Hidden Bullish Divergence
Hidden bullish divergence is a condition where the price chart is at a higher low while the technical indicator is at a lower low. Unlike the regular bullish divergence, hidden bullish divergence signals that the bullish trend will continue.
A hidden bullish divergence can be seen when there is a retracement or trend reversal only temporarily in the middle of an uptrend. To make things easier, here’s an example of a hidden bullish divergence chart:
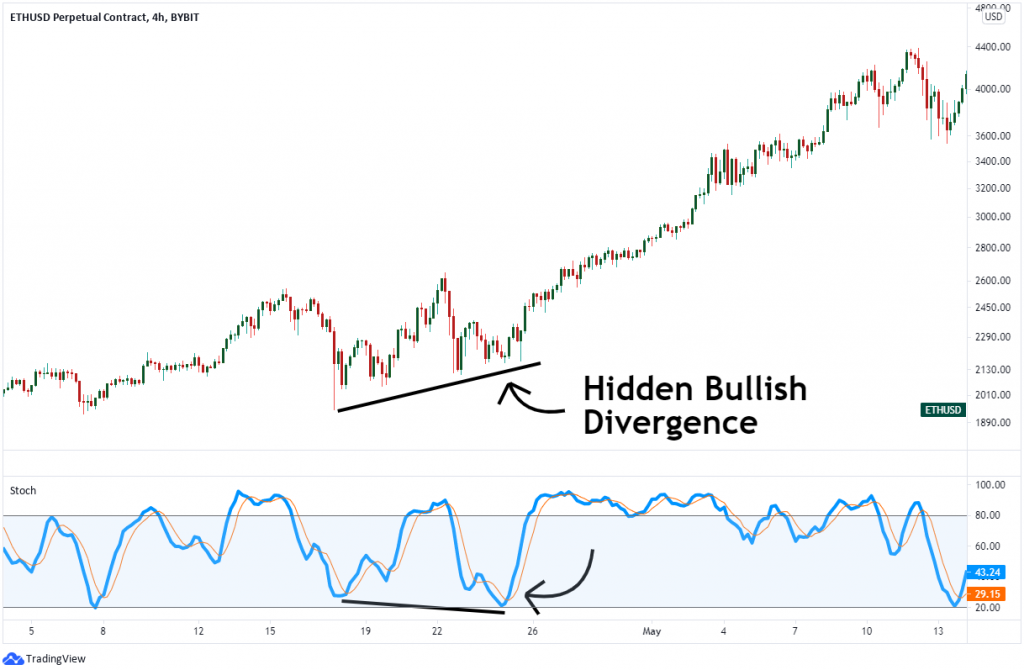
As you can see above, the price of ETH/USD experienced a retracement or a temporary correction. As a result, the ETH price chart fell to a higher low, while the stochastic indicator was at a lower low. The price drop is usually caused by profit taking, not massive selling pressure. Therefore, the price may rise after the fall, and the bullish trend will continue.
Bullish Divergence Indicator
Traders can use several technical indicators when looking for a bullish divergence signal. Here are several technical indicators that you can use to spot a bullish divergence signal.
1. Stochastic Oscillators
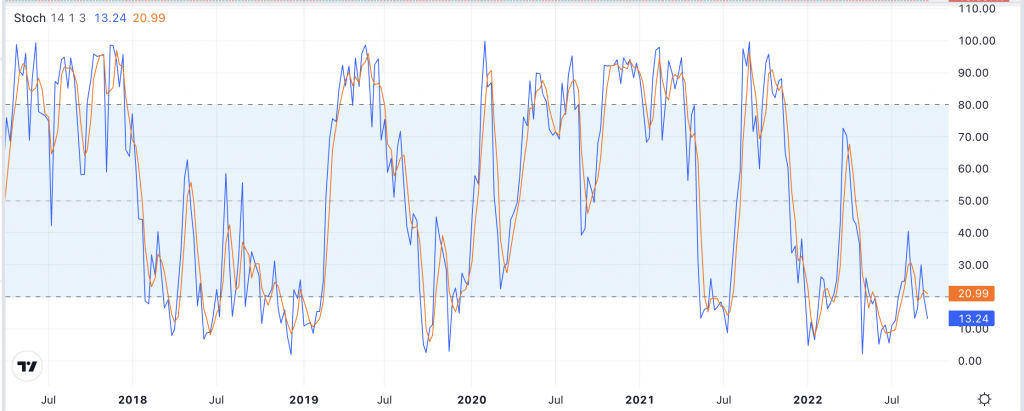
A stochastic oscillator chart is an indicator that helps traders to compare the closing price of cryptocurrencies to a spectrum of their prices during a specific period. This indicator is depicted in a chart with two lines where the upper and bottom areas have two areas that are overbought and oversold.
Stochastic oscillators are the most suitable technical indicator to spot a divergence signal. You can find the difference between the price direction with the tops or bottoms stochastic.
For example, bullish divergence signals can be spotted when the price is on a downtrend movement and at a lower low. Meanwhile, the stochastic oscillators indicator is at a higher low. These situations represent the bearish trend losing its momentum, and at the same time, the bullish trend is happening soon. But, if the opposite happens, a bearish divergence signal appears.
Stochastic oscillators have more dynamic character than other technical indicators, so it can give more divergence signals than the others.
2. Moving Average Convergence Divergence (MACD)
As the name indicates, MACD is an indicator based on a moving average which can be used to compare two moving averages. You can understand why a price movement is getting stronger or weaker through these two moving average relations.
When the two moving averages move away from each other with increasing momentum, those movements can be a divergence signal. But, if those two moving averages are close to each other and followed by slowing momentum, it’s called convergence.
In addition to spotting a divergence signal, you can also use the MACD to see the continuation of the market movement trend when the line is near the oversold or overbought area. As the MACD signal is taken when a crossover occurs, this indicator is called a “lagging” indicator.
3. Relative Strength Index (RSI)
Another technical indicator that can spot divergence signals is the Relative Strength Index (RSI). The RSI indicator just contains one line, moving between oversold and overbought areas. Unlike MACD, the RSI indicator has a leading character, so it can be used as an excellent indicator to spot divergence signals.
Like any other technical indicator, when the RSI indicator and price chart move in opposite directions, it shows a divergence signal. Meanwhile, the RSI indicator should be at a higher low for a bullish divergence signal, while the price chart should be at a lower low. This signal can also be a sign of entry trade for investors.
Don’t forget to read this article if you want to know about crypto trading indicator
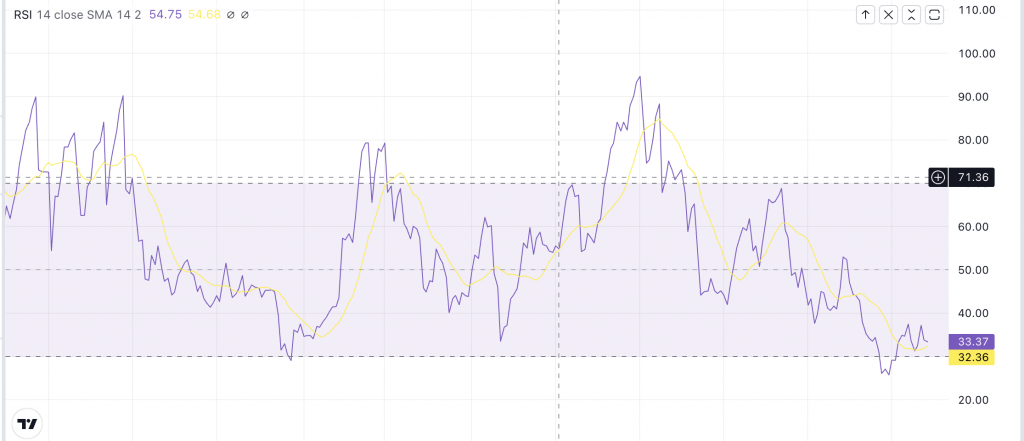
How to Analyze the Bullish Divergence
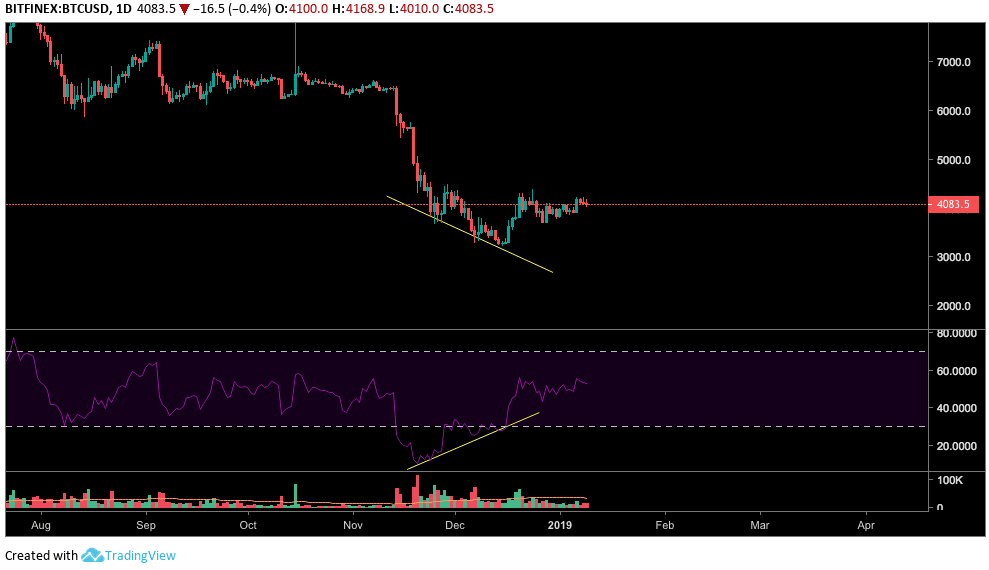
The BTC/USD price movement chart above exemplifies a bullish divergence pattern. If you look closely, the price of BTC/USD is experiencing a weakening trend where a new low is formed (lower low). But on the other hand, the technical indicator, the RSI (purple line), actually moved up and formed a higher low.
This can be interpreted that although the prices may be falling, market sentiment is gaining strength. After the correction, the price of BTC/USD moved up, confirming the emergence of a bullish divergence.
If you still feel confused and don’t know how to spot a bullish divergence in the crypto movement, here are several factors you should know first.
- In order to spot divergence patterns, two variables are needed in a chart. The first variable is the asset price chart, and the second is technical indicators such as RSI.
- Then, make sure the RSI indicator is in a reversal trend. Find the downtrend to uptrend movement if you want to spot bullish divergence.
- Next, find and analyze the area on the chart where the asset’s price shows the higher price followed by, the higher price.
- Traders also must know about different action prices that can lead to divergence.
Time Frame to Analyze the Bullish Divergence
After understanding how to analyze bullish divergence and the types of indicators that can be used, the next step is to determine the time frame for analyzing bullish divergence. In looking for divergence signals, the longer the selected time frame, the better and optimal it will be. The longer time frame can produce a more accurate signal search.
Short-term time frames tend to give a false signal because the divergence signals are found to be just noise. Therefore, the long-term time frame will be ideal for reducing the potential of false alerts. At least one hour is the perfect way to spot bullish divergence signals. However, the longer time frame will be much better.
Keep in mind the bullish divergence didn’t entirely mean a signal to enter the market. A bullish divergence merely shows the market tendency to strengthen, which may not be reflected in asset price movements yet. Meanwhile, another technical analysis is needed to find entry points with a shorter time frame.
This article will help you for making a trend line and deciding a support and resistance level
Trading Tips in Divergence Market
When you want to trade in a divergence market, the most important thing is to spot the divergence itself. So, train yourself by looking at bullish divergence signals based on historical data. It will make it easier to find the bullish divergence in real-time.
Most traders use Stochastic oscillators and RSI as their technical indicators to spot divergence signals because both are the leading indicator. A leading indicator can show the direction of the next price movement before it appears on the chart.
In addition to finding a bullish divergence, make sure to find a bullish hidden divergence too. This signal can confirm the continuation of the bullish trend. The combination of bullish and hidden bullish divergence can make the signal more accurate.
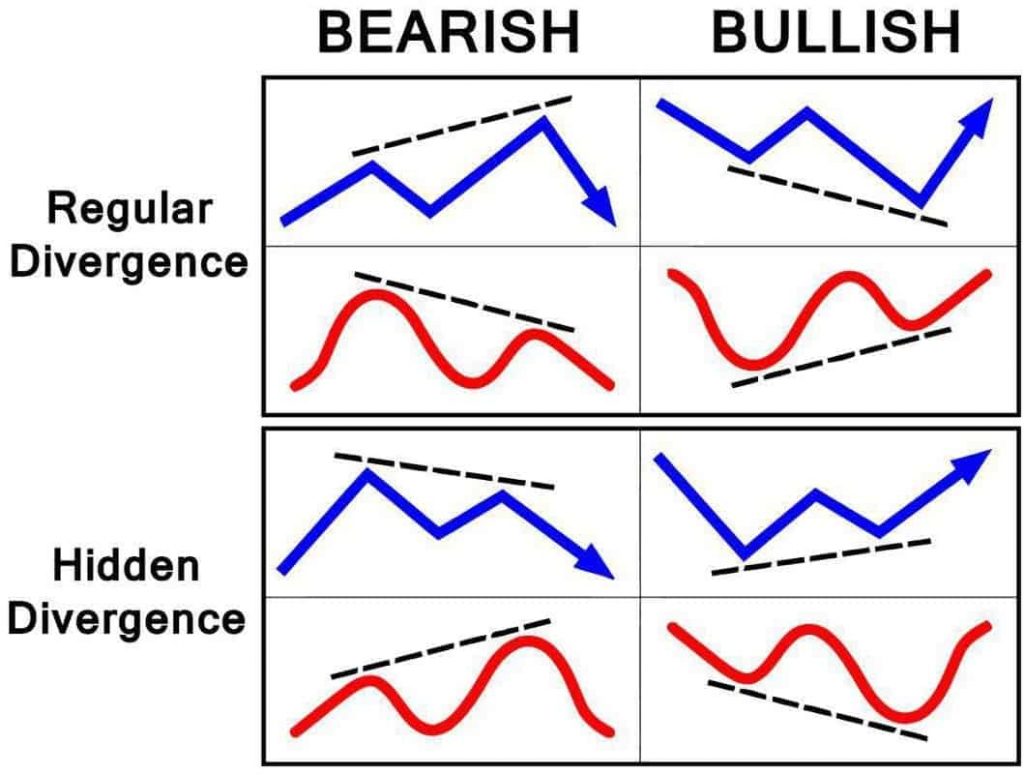
To make things easier, here is a cheat sheet that you can use to spot regular divergence and hidden divergence:
Next, trading at the right time. Traders must be patient and composed when finding confirmation of price action. For your information, price action happens when the price successfully passes the trend line. In addition, it can be the right time to trade whenever the price gives resistance.
As a form of risk mitigation, you should place your stop-loss below the reversal limit. This way, you can reduce your potential loss when the price doesn’t go upward and instead continue to weaken. Meanwhile, you can place your target price by making a trend line to maximize your potential returns.
A trader also can’t rely on one technical indicator to determine whether the asset is experiencing a bullish divergence. So, using the other hand to confirm the bullish divergence signal is better.
If you want to try trading, this is crypto trading techniques you need to know
Start Investing at Pintu
After learning how to find bullish divergence signal, don’t forget to try implementing it when you do your transaction at Pintu. Through Pintu, you can invest in various crypto assets such as BTC, BNB, ETH, and others safely and easily.
Pintu is also compatible with popular wallets such as Metamask to facilitate your transactions. Download the Pintu app on Play Store and App Store! Your security is guaranteed because Pintu is regulated and supervised by Bappebti and Kominfo.
Besides making transactions, in the Pintu Apps, you can also learn more about crypto through various Pintu Academy articles which are updated every week! All Pintu Academy articles are made for knowledge and educational purposes, not as a financial advice.
Referensi
John Jagerson, How to Trade Bullish and Bearish Technical Divergences, Learning Markets, accessed on 22 September 2022.
Bybit Learn, Hidden Bullish & Bearish Divergence: How to Apply For Crypto Trading? Bybit, accessed on 22 September 2022.
Bybit Learn, The 15 Best Technical Indicators You Must Know, Bybit, accessed on 22 September 2022.
Cex IO University, What is a Bullish Divergence? accessed on 22 September 2022.
Barclay Palmer, Bullish Divergences and Bearish Reversal Signals, Investopedia, accessed on 22 September 2022.
Benjamin Pirus, What is Bullish and Bearish Divergence In Crypto? Crypto Potato, accessed on 23 September 2022.
Cheat Sheets, Divergences in Crypto Trading, Altcoin Trading, accessed on 23 September 2022
School of Pipsology, 9 Rules for Trading Divergences, Baby Pips, accessed on 23 September 2022
Share