Market Analysis Mar 13-19: Bitcoin Moving in Sideways and Vitalik Buterin Became the Face of TIME Magazine

Bitcoin (BTC) price movement 13-19 March
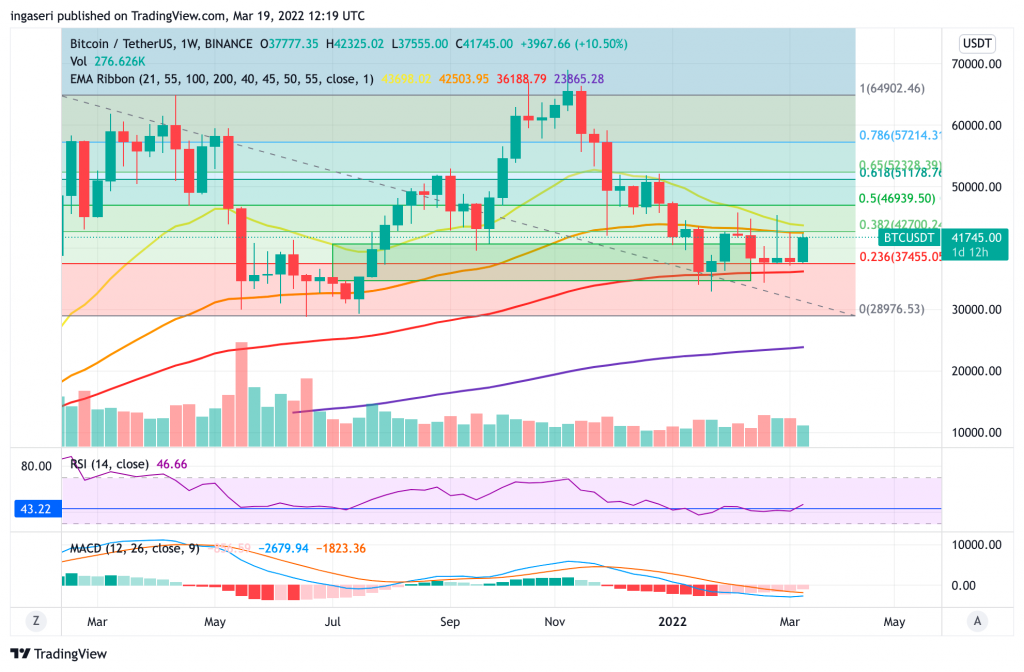
The weekly chart shows Bitcoin has been moving sideways for the past week. Besides that, over the past week, the movement of Bitcoin has fluctuated between the price of $37,500 to $41,750. In the chart above, we can see strong resistance at the 55-week EMA, where Bitcoin price has been below it for 10 consecutive weeks. Currently, the point of resistance is at $42,500 and support is at $37,500.
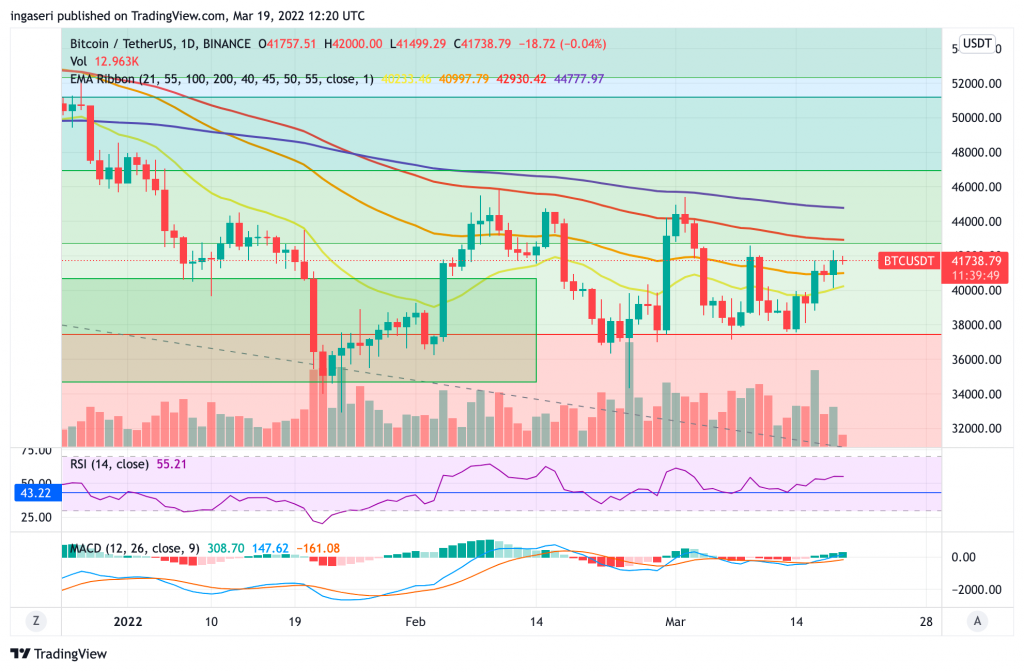
On the daily chart, we can see resistance at the 100-day EMA. This is BTC’s second attempt to break the 100-day EMA. The price has been below this resistance line since December 3 last year, with a total of 3 attempts to break this line. Nonetheless, BTC has risen above the 55-day EMA line, which is a positive sign. Previously, in early February BTC managed to move up above this line but it only lasted a few days before it falls again.
Read more: What is support and resistance level?
What else is there to observe from BTC in the past week?
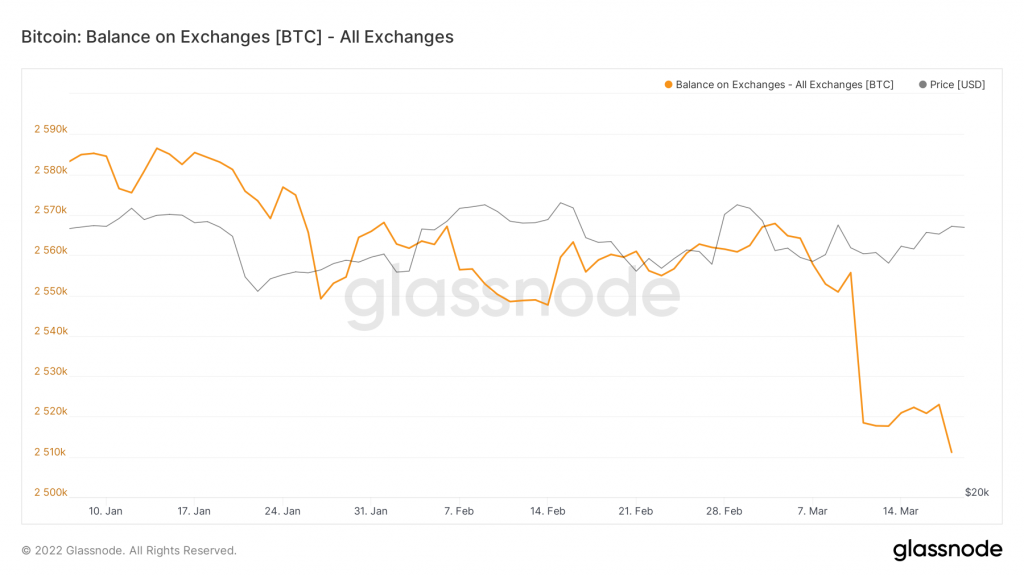
- 💵 Total balances in exchange continue to decline: Since March 3, Bitcoin balances at exchanges such as Binance have continued to decline. This data shows many people are buying Bitcoin, even though the price is moving sideways.
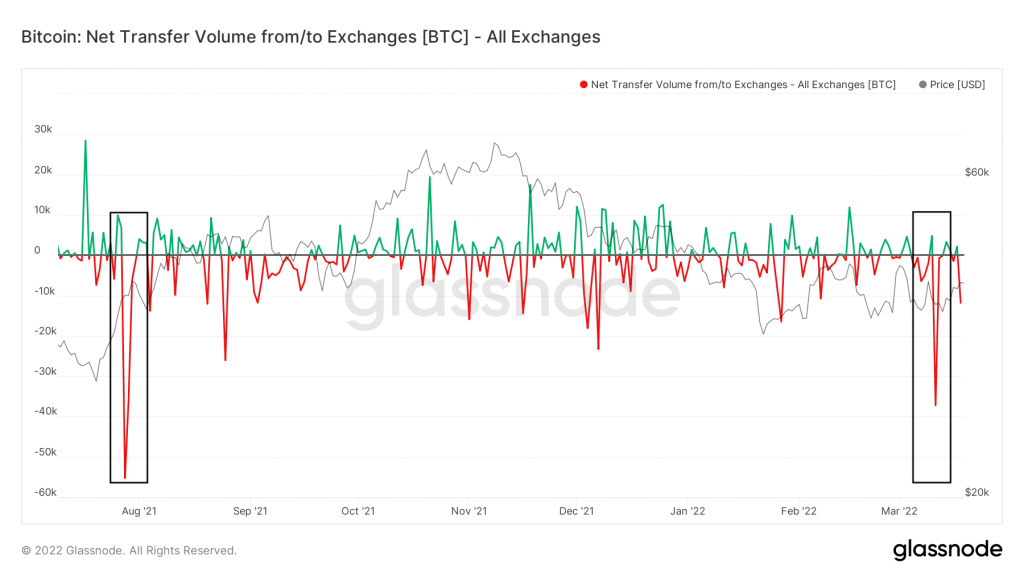
- 🌊 Net flow in exchanges: Another interesting graph is the net flow volume in Exchanges. Watch the spike in net outflows on March 11, amounting to a net outflow of 37,220 BTC. The last time such a large net outflow occurred was in July 2021 when the BTC price was $40,000 and it undergo a major rally over the next 4 months after that.
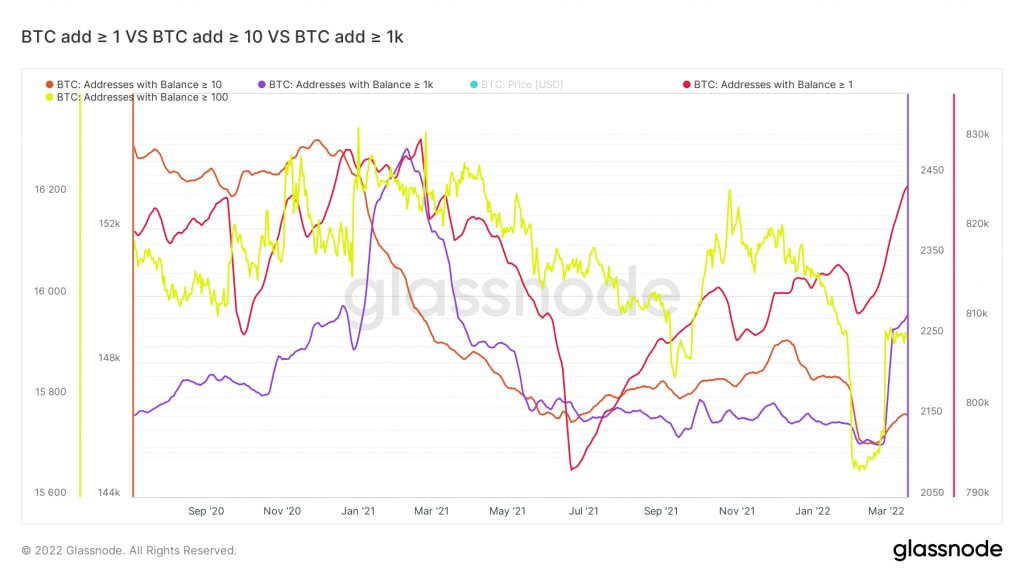
- 🏠 Increasing number of Bitcoin addresses: Bitcoin holder addresses totaling in 1, 10, 100, and 1,000 BTC have all shown a significant increase since late February. This signifies a wider adoption of Bitcoin from existing holders as well as new holders who feel that now is the right time to buy the asset.
Market analysis conclusion
- 💪 The conflict in Ukraine strengthened the value of Bitcoin in the absence of other financial networks. This has pushed the value of Bitcoin up over the last few weeks since the war started. The adoption of crypto assets is once again being tested and is in a pivotal moment.
- 🚧 Bitcoin is still stuck in a sideways movement or sideways. Although the analysis of some on-chain fundamental indicators shows bullish signs, periods of sideways movement can destroy swing trades due to price fluctuations.
Important news from the crypto world in the past week
- 🤝 Interest rate hike at the FOMC meeting: On Wednesday, March 16, the FOMC meeting resulted in the decision to raise the interest rate by 25 points or 0.25%. However, the news of the meeting did not affect Bitcoin and even pushed its price to touch the $40,000 mark. However, the Fed announced it would tapering at its next meeting but did not say when.
- 🐵 BAYC NFT Collection releases APE coin: NFT Collection Bored Ape Yacht Club or BAYC, announced the release of its own token, APEcoin (APE). These tokens are airdropped to those who have NFT BAYC and can also be purchased on several exchanges. Yuga Labs, the organization behind BAYC, explained that the APE coin will be used in all future BAYC projects, including the upcoming blockchain-based game.
- ⚖️ President of Ukraine signs legalization and regulation of crypto assets: The President of Ukraine, Volodymyr Zelensky, signs the law on virtual assets legalizing cryptocurrencies in Ukraine. This regulation regulates the crypto industry in Ukraine and clarifies the laws regarding it.
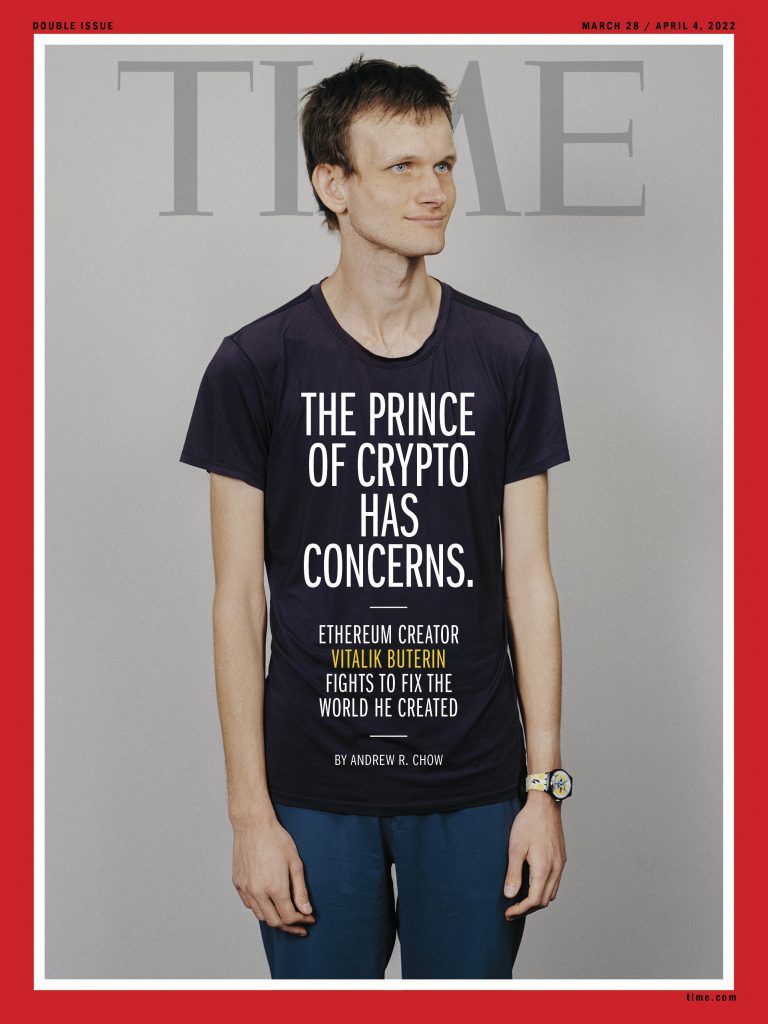
- 📚 Vitalik Buterin on the cover of TIME magazine: The popular TIME magazine conducted an interview with Ethereum founder, Vitalik Buterin, who is the cover face of the magazine. The interview explained Vitalik’s concerns about the crypto world and his vision for Ethereum. For the first time, TIME will also release an interactive NFT version of this issue, in partnership with LitDAO.
News from the Altcoin world
- 🌕 LUNAVAX: Terra’s (LUNA) largest DeFi protocol , Anchor Protocol, announces Integration of its savings app with Avalanche, opening Avalanche users access to UST.
- 🌑 LUNA x Thorchain: Thorchain, a multichain DEX blockchain, announced the integration of LUNA and UST assets into its application to unlock access to the liquidity pool from native Terra assets.
- 🤑 $22 million dollar bet: Do Kwon, CEO of Terraform Labs, and 2 people from the Twitter crypto community made a bet on the price of LUNA. Two people from the Twitter community (@AlgodTrading and @GiganticRebirth) are betting that next year’s LUNA price will be less than it is now ($88 dollars at bet time). Do Kwon then answered the bet and believed that the price of LUNA would be higher.
References
- Kate Iriwn, Ukraine President Signs Law Legalizing and Regulating Crypto Assets, Decrypt, accessed on 20 March 2022.
- Kate Iriwn, ApeCoin Launches for Bored Ape Ethereum NFT Holders With Reddit, FTX, Animoca Execs on Board, Decrypt, accessed on 20 March 2022.
- Helene Braun, Fed Raises Benchmark Interest Rate by 25 Basis Points, Coin Desk, accessed 20 March 2022.
- Jordan Lyanchev, Doubling Down: Terra CEO Bets Another $10 Million on LUNA’s Price in a Year, Crypto Potato, accessed on 20 March 2022.
- TerraLUNADaily, https://twitter.com/TerraLUNADaily/status/1504850699141668865, accessed on 20 March 2022.
- THORrChain, https://twitter.com/THORChain/status/1504702833622679552, accessed on 20 March 2022.
- Sam Bourgi, Vitalik Buterin talks crypto’s perils in Time Magazine interview, Coin Telegraph, accessed on 20 March 2022.
- Andrew Chow, Ethereum’s Vitalik Buterin Is Worried About Crypto’s Future, TIME, accessed on 20 March 2022.
Share
Related Article


See Assets in This Article
BTC Price (24 Hours)
Market Capitalization
-
Global Volume (24 Hours)
-
Circulating Supply
-