Understanding Support and Resistance in Crypto Trading
In crypto trading, knowing support and resistance points are essential. By learning these two things, traders can find out the level as a marker of whether the asset price will move up or down. Understanding the support and resistance helps determine the ideal level for buying or selling the asset. Check out the following article so you can find out how to determine support and resistance levels
Article Summary
- 💡 Support and resistance are two technical analysis indicators that are crucial in crypto trading. These indicators refer to the level of price that acts as a “barrier”or prevents it from moving higher or lower.
- 📈 To make it easier to find support and resistance, traders can use how to determine the trendline first.
- 📊 In trading activities, understanding support and resistance is needed to determine the right time to buy and sell assets.
What is Support?
When there is a downward trend in the price of an asset, support is a level on a price movement chart that holds or stops the price from falling further. When the value of an asset reaches the support level, traders expect the price to begin to rise rather than fall further.
Support is usually supported by an increase in buying volume. When the price of an asset falls, some investors will jump at the chance to buy in the hopes of seeing the price rise again. At the same time, other investors continue to cling to their assets and decide not to sell them, even when the value declines. This is what forms the support level.
Read more: Introduction to Technical Analysis in Cryptocurrency
What is Resistance?
In contrast to support, resistance is a price level that prevents an asset’s price from rising. When a price trend continues to climb, the asset’s value will eventually stop increasing, which is known as resistance.
Resistance is triggered when a large number of investors sell their assets to profit from high prices. As the number of asset sales increases, a resistance level is established, preventing the price from skyrocketing further.
block💡 The support level indicates an increase in the volume of asset purchases when the price is falling. Meanwhile, the resistance level indicates that many investors choose to sell assets and take profits at that price point.
Read more: 4 Crypto Trading Indicators You Should Know
How to Use Support and Resistance Indicators when Trading?

https://tradingcryptocourse.com/free/technical-analysis-trendlines/
Determine the Trendline
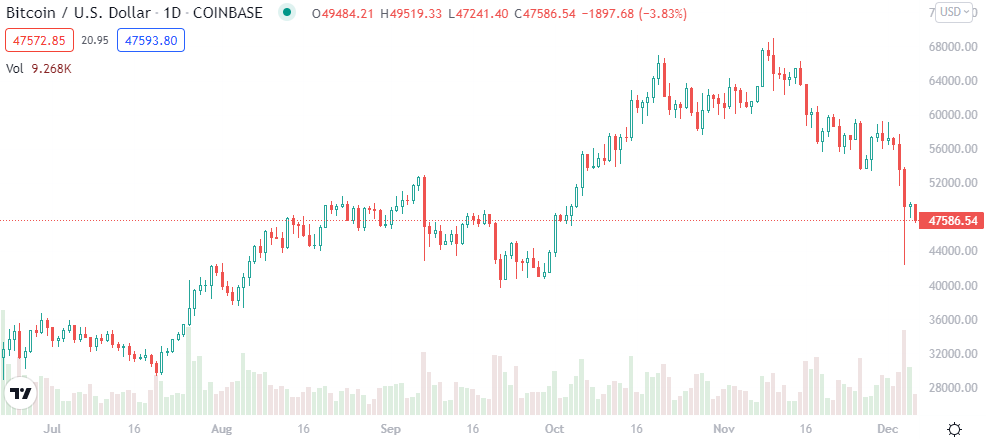
To use the support and resistance indicators, traders first need to pay attention to the trendline, or diagonal line that shows an upward or downward trend in asset prices.
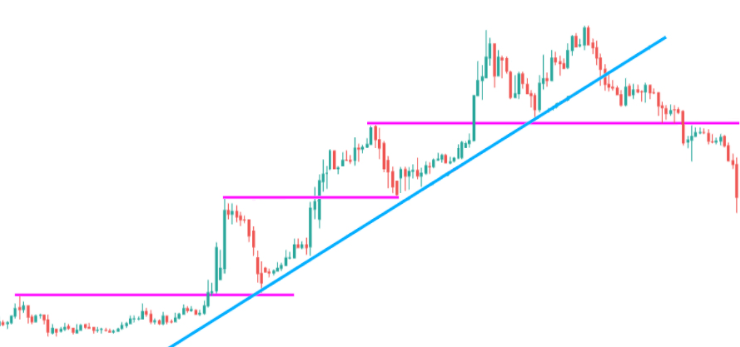
In the chart above, the blue line indicates an upward trend in price, while the pink horizontal line indicates support and resistance levels.
To determine a trendline, it is necessary to have at least two or three rising and falling curves on the chart, and the trader will connect the curves to form a diagonal line. However, determining the trendline depends on each trader, on which price level he wants to connect.
Some traders connect the closing price, some combine the opening, closing, high and low prices.
The more price points a trendline touches, the more accurate the line will be to assist in making trading decisions.
Read more: FOMO and the Psychology of Crypto Trading
Buy Assets in the Support Area, Sell in the Resistance Area
After determining the trendline, it will be easier for you to find support and resistance levels. Support and resistance levels are indicated by pink lines in the chart above.
Ideally, traders will buy the asset when the price is in the support area, and sell it when the price is in the resistance area. Determining precise support and resistance areas is not always easy, and there is always the possibility of a support or resistance level breaking and the price going up or down past the level.
This indicator is used to help make decisions when trading, and is not an absolute reference. So, in addition to technical understanding such as recognizing support and resistance levels, it is also necessary to understand other aspects, including fundamental analysis before trading.
Read more: 4 Crypto Trading Techniques You Need to Know
Conclusion
- Support is a price level viewed horizontally that is expected to hold or prevent the price of an asset from falling further. Meanwhile, resistance is a price level that prevents the value of an asset from going higher.
- Support and resistance indicators are used to help make decisions to buy or sell assets.
- Ideally, traders will buy the asset when the price is in the support area and sell it when the price is in the resistance area.
Reference:
- CoinMarketCap. (2021, August 20). Technical analysis 101: How to find support and resistance zones?: CoinMarketCap. CoinMarketCap Alexandria. Retrieved November 30, 2021
- Murphy, C. (2021, November 20). Support and resistance basics. Investopedia. Retrieved November 30, 2021
Share