Market Analysis May 13th, 2024: BTC Price Faces Downward Pressure: Potential Drop to $56K

Over the past three weeks or so, Bitcoin has been consistently hovering around the $60,000 price mark. Recently, a Bitcoin ETF began trading in Hong Kong, with a combined inflow of BTC ETF funds totaling $15.8 million according to Farside. Considering these developments, what additional factors might contribute to a potential rise in BTC’s price, or will it continue on a downward trajectory? Check out the analysis below.
As usual, the Pintu trading team has gathered critical information and analyzed the general economic situation and the crypto market’s movements over the past week. However, it should be noted that all information in this Market Analysis is intended for educational purposes, not as financial advice.
Market Analysis Summary
- 🔴 If BTC breaks below the $59K threshold, it could potentially encounter a price of $56K
- 📈 Unemployment rate increased to 3.9% from the previous month’s 3.8%.
- 💼 Jobless claims in the US in early May jumped to the highest level in eight months.
- ⚠️ The ISM Services PMI contracts for the first time since December 2022.
Macroeconomic Analysis
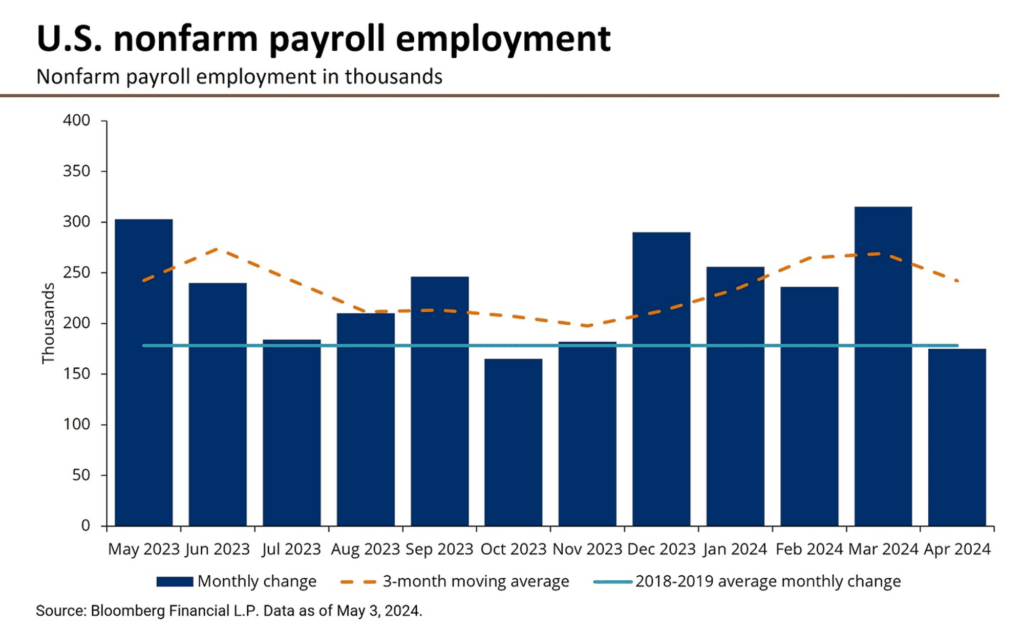
Non Farm Payrolls
Hiring in April fell short of expectations, indicating a cooling trend in the U.S. labor market. According to the Bureau of Labor Statistics data released today, the U.S. added 175,000 jobs, compared to the anticipated 235,000, marking the slowest gain in six months.
Other Economic Indicators
- U.S Unemployement Rate: In April, the US unemployment rate rose slightly from 3.8% to 3.9%, marking the 27th consecutive month below 4%. This increase was primarily driven by higher rates among older workers, while rates for younger workers and other younger age groups remained stable or declined. Wage growth also edged up 0.2% compared to the previous month. Although employment figures for February and March were revised down by 22,000 jobs, the first quarter still saw average monthly job gains reach 269,000 positions.
- Services PMI: In April, the U.S. services PMI reached 51.3, slightly exceeding expectations, marking the 15th consecutive month of expansion. This growth, however, hints at a slow start for the economy’s second quarter, alongside a slowdown in manufacturing output. Consequently, overall business activity in April expanded at its slowest pace in the year so far, with the PMI suggesting a modest 1.5% annualized GDP expansion for the quarter. The decline in new orders and business confidence, coupled with cautious staffing approaches, reflects weakening demand and expectations of prolonged higher interest rates. Inflation showed some relief as service prices rose slower, but concerns over geopolitical uncertainties and ongoing staffing challenges persist.
- Jobless Claims: The US Labor Department reported a jump in new jobless claims in the US in the first week of May to 231,000, the highest level in eight months. This surge indicates a gradual slowdown in the labor market, following reports of declining job growth in April and a three-year low in job openings reached in March. While the number of people receiving benefits after the first week of assistance rose slightly to 1.785 million, the increase in jobless claims may not necessarily reflect a continued upward trend in job cuts. It could partly be due to seasonal adjustments following the school spring break.
BTC Price Analysis
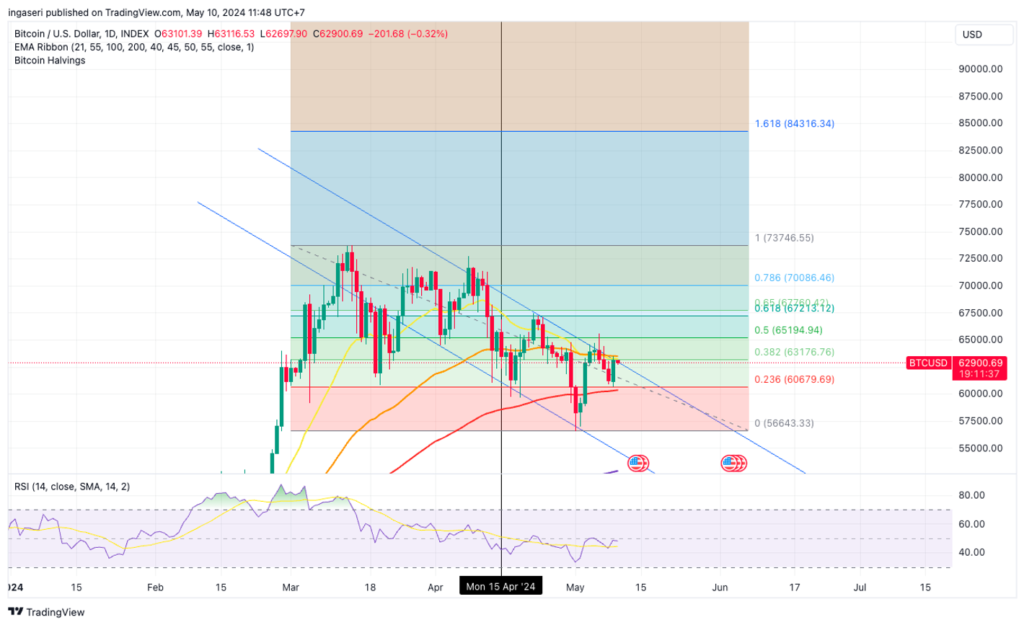
After experiencing a modest bullish recovery from the significant support level of $59K, BTC faced selling pressure, leading to a retracement towards the crucial 100 day MA situated at $60,500. The price movement at this pivotal point is expected to determine its forthcoming decisive direction.
BTC has been in an extended phase of sideways consolidation, lingering around the crucial $60K price range. It recently experienced a downturn following a significant bullish rebound from the $59K mark, resulting in a retreat towards a vital support zone. For several weeks, BTC sellers have been contending with breaking through this significant support area, which encompasses both the 100 day MA. Dropping below the $59K threshold could initiate another notable downward trend towards the $56K mark.
We have yet to see in the coming weeks whether we will have mid term support or whether we will face more downward pressure.
On-Chain Analysis
- 📊 Exchange: As the exchange reserve continues to rise, it indicates higher selling pressure. Net deposits on exchanges are low compared to the 7-day average. Lower deposits can be interpreted as lower selling pressure.
- 💻 Miners: Miners’ are selling holdings in a moderate range compared to its one-year average. Miner’s revenue is in a moderate range, compared to its one-year average.
- 🔗 On-Chain: More investors are selling at a profit. In the middle of a bull market, it can indicate a market top. Long term holders’ movement in the last 7 days were lower than the average. They have a motive to hold their coins. Investors are in an anxiety phase where they are currently in a state of moderate unrealized profits.
- 🏦 Derivatives: Long position traders are dominant and are willing to pay to short traders. Buying sentiment is dominant in the derivatives market. More buy orders are filled by takers. As OI increases, it indicates more liquidity, volatility, and attention are coming into the derivative market. The increasing trend in OI could support the current ongoing price trend.
- 🔀 Technicals: RSI indicates a neutral condition. Stochastic indicates a neutral condition where the current price is in a moderate location between the highest-lowest range of the last 2 weeks.
News About Altcoins
- Meme Coin Mania Continues Despite Bitcoin Slump. The popularity of meme coins is reaching new heights as Bitcoin (BTC) struggles. Data from CoinMarketCap reveals a record 138 meme coins listed in April, a massive jump from just 18 in the same month last year. This significant increase has led to a booming meme coin sector with a combined market capitalization exceeding $50 billion, rivaling companies like JPMorgan and Tesla. Despite criticism for their lack of utility, meme coins continue to attract interest due to their potential for speculative gains and entertainment value. Even Ethereum Founder Vitalik Buterin acknowledges their appeal, recognizing their potential to increase value and inclusivity.
News from the Crypto World in the Past Week
- Jack Dorsey: Bitcoin to Hit $1 Million by 2030. Since stepping down in 2021, Jack Dorsey, the former Twitter CEO (now X), has shifted his focus to cryptocurrency and blockchain innovation. He predicts that the price of Bitcoin (BTC) will reach $1 million by 2030, and potentially go even higher. Dorsey emphasizes the unique aspect of Bitcoin’s increasing value. He believes it’s driven by the collective efforts of everyone who invests in, works with, or uses the cryptocurrency. This collective effort, according to Dorsey, strengthens the entire ecosystem, thus pushing the value of Bitcoin up.
Cryptocurrencies Market Price Over the Past Week
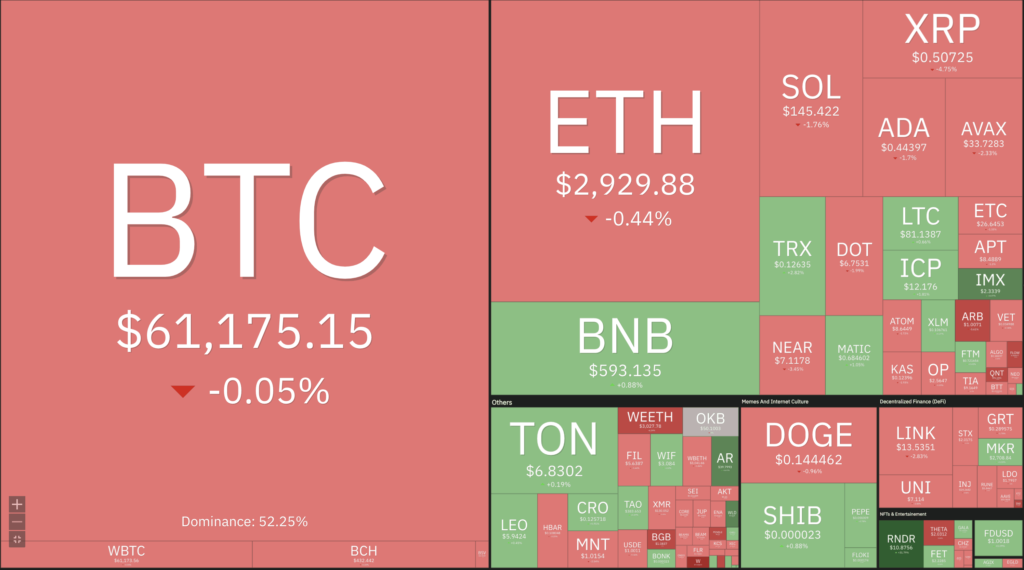
Cryptocurrencies With the Best Performance
- Akash Network (AKT) +33,84%
- Render (RDNR) +24,75%
- Toincoin +19,28%
- Worldcoin %15,03%
Cryptocurrencies With the Worst Performance
- Helium (HNT) -17,73%
- Wormhole (W) -16,47%
- Stacks -16,05%
- Optimism -15,23%
References
- Omkar Godbole, Meme Coin Demand Is Stronger Than Ever With Fast Money Chasing Pepe and WIF: Analyst. Coindesk, accessed on 11 May 2024.
- Helene Braun, Jack Dorsey Says Bitcoin Price Will Go Beyond $1 Million in 2030, Coindesk, accessed on 11 May 2024.
Share
Related Article


See Assets in This Article
1.5%
0.0%
0.0%
0.0%
0.0%
BTC Price (24 Hours)
Market Capitalization
-
Global Volume (24 Hours)
-
Circulating Supply
-