Market Analysis May 16-22: BTC Closes in Red for 8 Weeks in a Row & Ethereum ‘Merge’ to Launch in August 2022

BTC Price 16-22 May
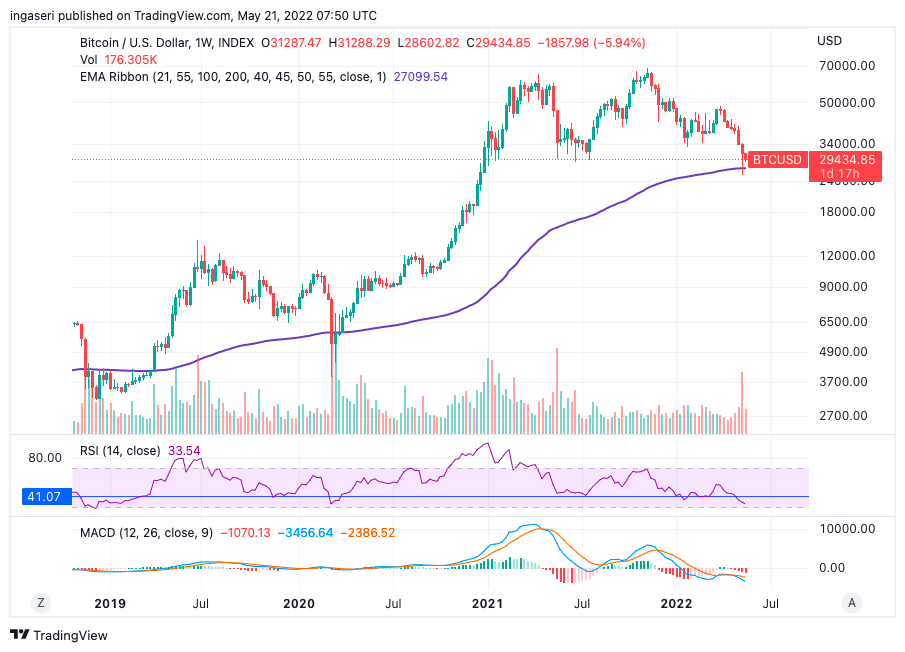
Over the past week, Bitcoin has moved sideways within a price range of US$28,500 to 31,500. As of last week, the support level was still at around 30,000. If BTC breaks through this support level, there is a possibility for BTC to immediately drop to a price level of 24,000 US dollars. With the current macro sentiment, it’s hard to say whether BTC has reached the bottom or not.
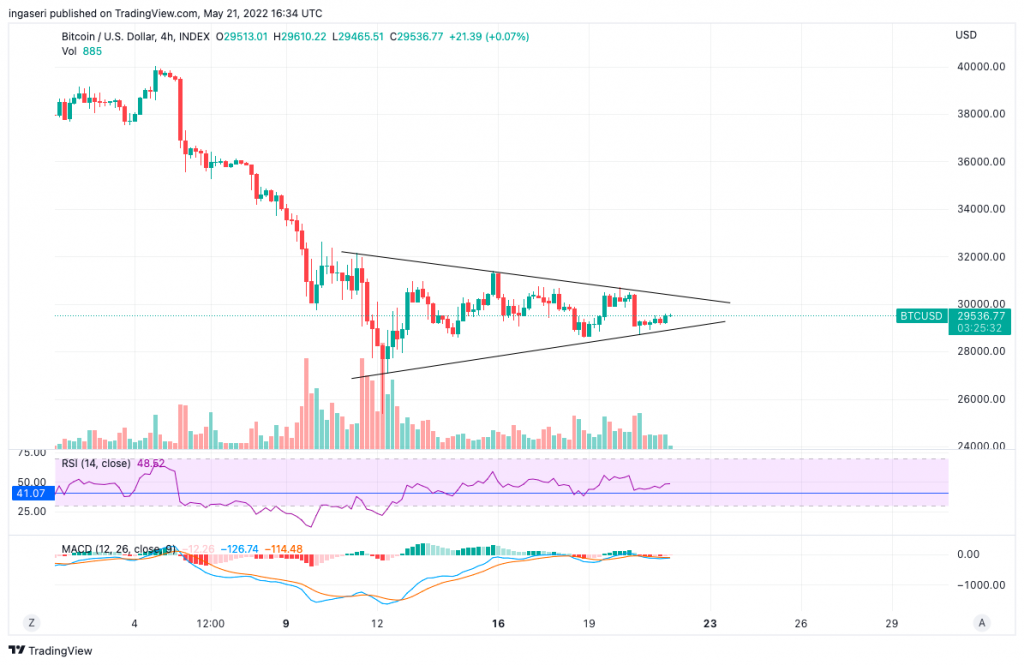
On the 4-hour chart, which can be seen below, you can see the formation of a symmetrical triangle pattern. Although this tends to be a continuation pattern of the bearish trend, it is possible that the continuation of the downward trend will only occur in the short term. If the price manages to break above and retest the trend line, BTC may move up to the 34,000 price area. If BTC continues the bearish pattern, which is a more likely scenario, BTC may continue to fall to the 24,000 price area.
The value of the RSI 41 is important to watch out for, because historically, every time BTC crosses the value of the RSI 41 on a 4-hour timeframe, a decline is expected.
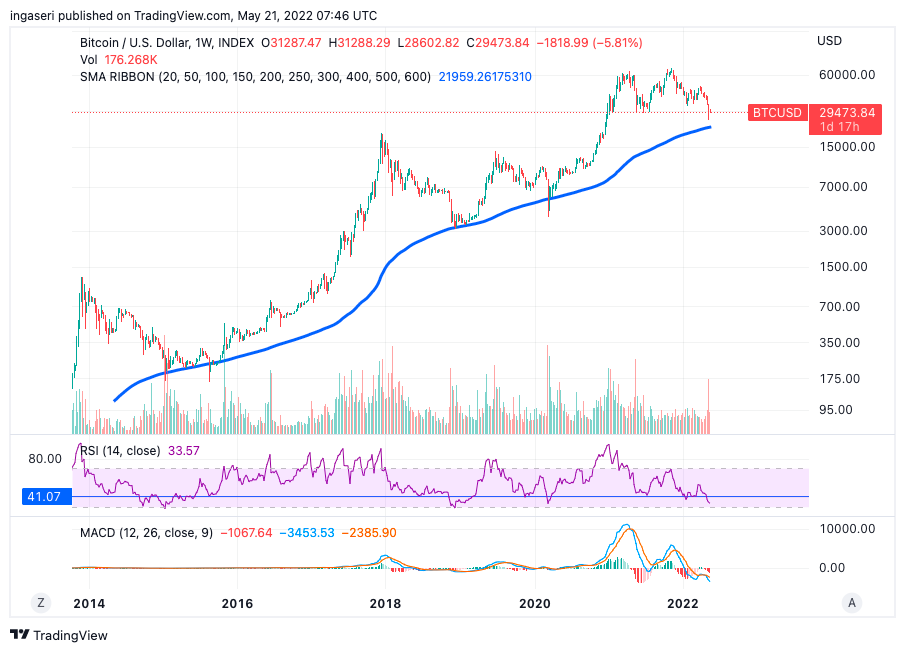
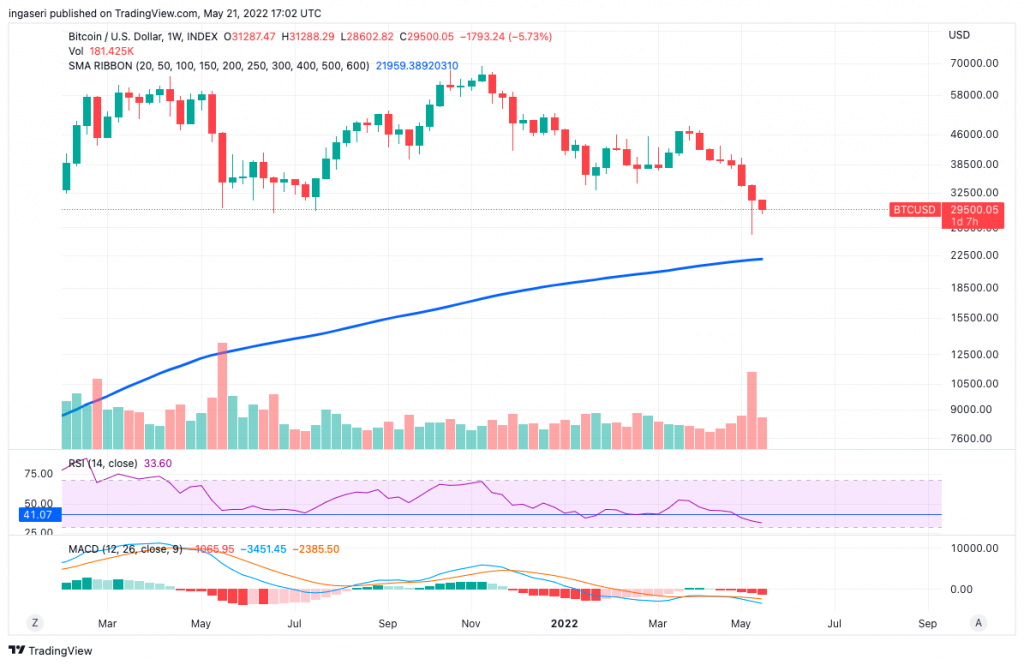
The 200-week moving average chart is always strong support during a bear market, and we can see that the 200-week moving average support line is currently at US$22,000. If it is further consolidated from the current price, expect support in the 22,000-24,000 range.
As we can see in the chart below, BTC also experienced 8 consecutive red candles for the first time in BTC history.
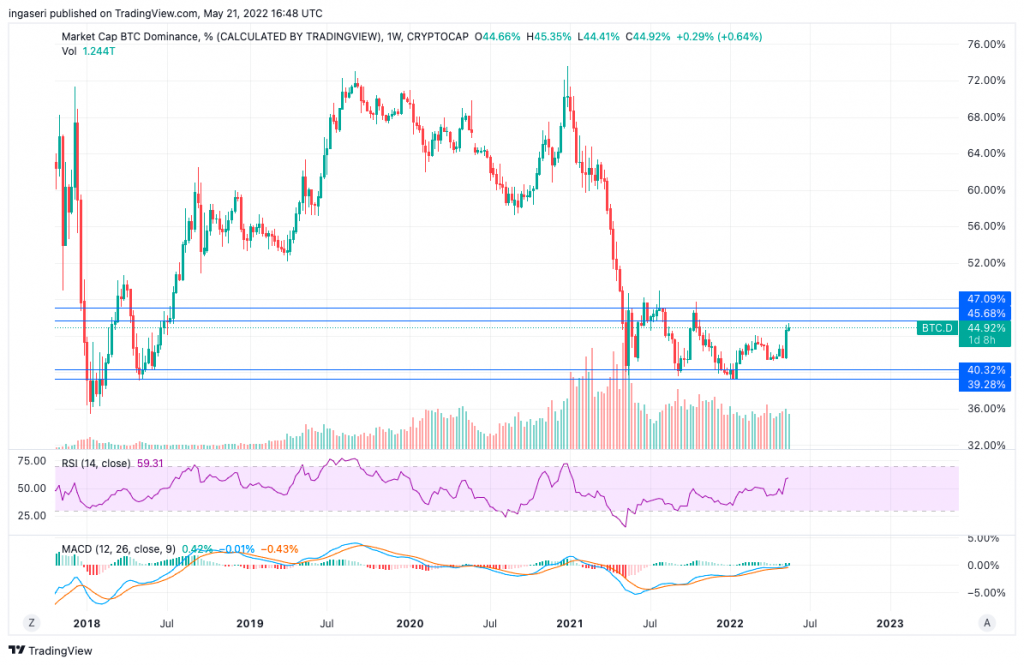
Note that Bitcoin Dominance has increased quite significantly over the last 2 weeks as in the chart below. Anticipate an increase in Bitcoin Dominance to the 45-47% range. If BTC can get past that number, then BTC will be a better choice compared to Ether or altcoins in these difficult times.
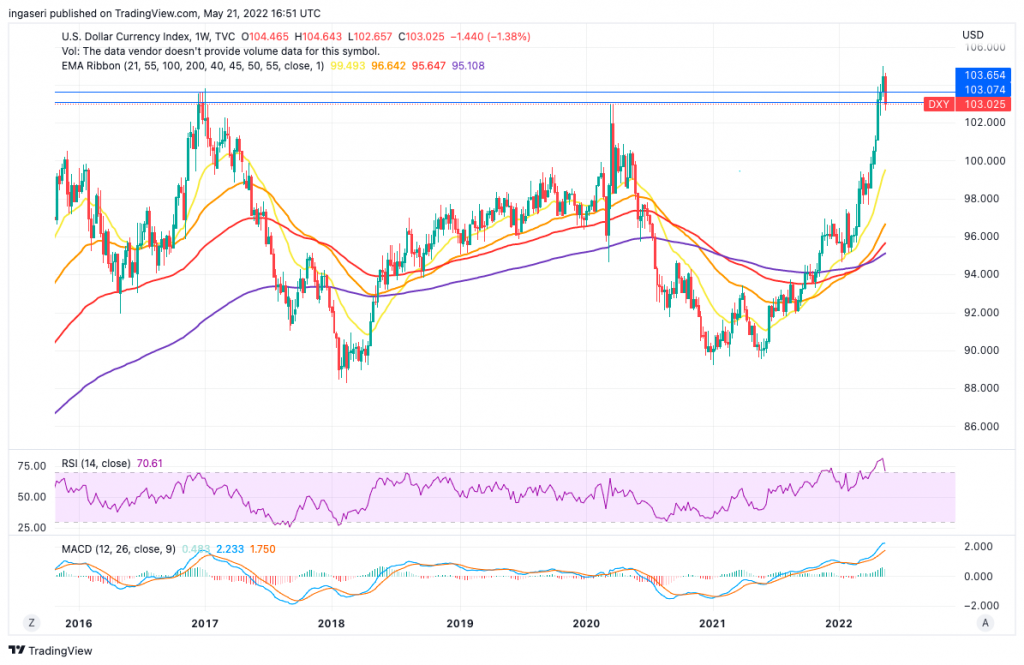
Meanwhile, the DXY chart as shown below still looks very bullish, especially following the Fed’s rate hike earlier this month. We can see that we are still in a bullish trend for DXY. Notice that we’ve broken out of the previous resistance line of 103.025 and now we’re holding support at that value.
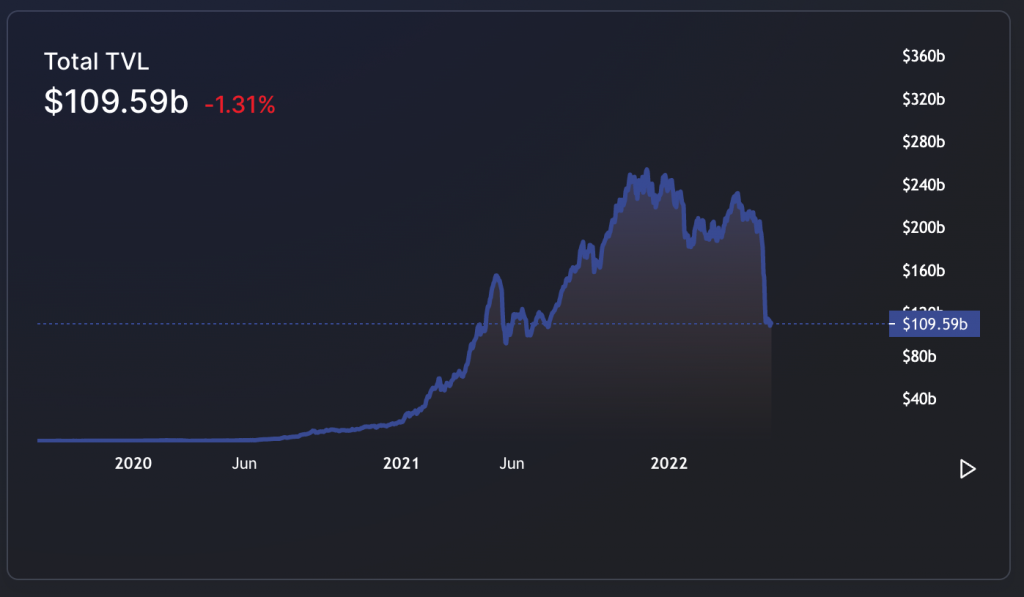
Total Value Locked (TVL) for decentralized finance is still in a downward trend, and is currently at the same level as last June. TVL on DeFi is down more than 50% when compared to the number recorded at the beginning of the year. The DeFi market is very fragile at the moment, considering that during a bear trend, DeFi is one of the hardest hit sectors.
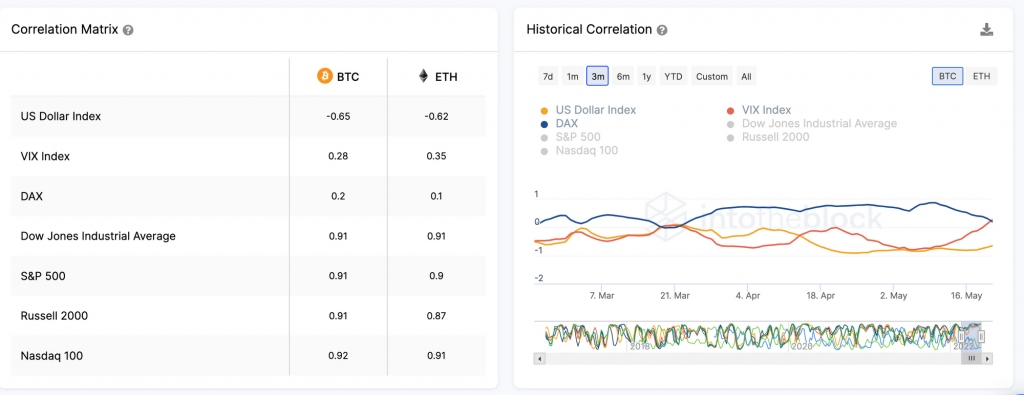
The correlation between the equities market and crypto remains very high, as shown below. The correlation matrix is showing that the crypto market is moving in tandem with the DJIA (Dow Jones Industrial Average), S&P, and Nasdaq. 30-day correlation is above 0.9.
On-Chain Analysis
- 📊 All Exchanges’ reserves remain at over a 3-year low. Slight increase in Spot Exchanges, but the reserve is still low compared to last week, while the Derivatives Exchanges’ reserve remains at the same level. Whales and Miners are holding. The number of BTC being transferred to Derivatives Exchanges is still high.
- ⚠ Market Sentiment is more dominant toward the short position. Open interest has increased by $1B. The estimated leverage ratio shows that the futures market is over-leveraged. Both short-term and long-term holders are selling at a loss. MVRV and NUPL indicators signal that the current Bitcoin price is reaching close to the undervalued position.
Analysis Summary
- 🚩 Over the past week, BTC has moved sideways in the price range of US$28,500 to US$31,500. BTC also recorded a red candle for 8 consecutive weeks for the first time in BTC history.
- 📉 Total Value Locked (TVL) for decentralized finance (DeFi) is still on a downward trend, with a decrease of more than 50% compared to the figure recorded at the beginning of the year. More about over
News From the Altcoins World
- 🔗 Ethereum Merge will launch in August: Preston Van Loon, one of the main developers of Ethereum, announced that they are ready to execute ‘the merge’ in August. Preston also stated that the Ethereum team is in the testing phase, with the goal of merging to take place in August if no more issues arise.
- 🎵 Universal Music Group will release NFT on Algorand network: Limewire, one of the popular P2P music platforms, plans to relaunch its platform as a music marketplace in the form of NFT Limewire will launch its NFT market on the Algorand network and announced that it had formed a partnership with Universal Music Group. Universal Music Group is a music brand that houses popular artists such as BTS, Taylor Swift, and The Weeknd.
- 🖼 NFT creator Beeple’s account hacked: The Twitter account of Beeple, one of the most popular NFT creators, was just hacked on May 22. The culprit then sent several tweets containing a phishing link promising free NFT. These perpetrators managed to get US$438,000 from the action.
- 🌖 Terra’s Final Hard Fork Plan: Do Kwon, CEO of Terra, explains his final plan for regenerating the Terra network. The plan is to perform a hard fork or branch the Terra network to a new blockchain line. The new network will have LUNA tokens reset in number in the absence of UST, Terra’s algorithmic stablecoin. The currently circulating LUNA token will be renamed LUNC (Luna Classic). This plan was met with criticism from the crypto community who called it an authoritarian plan. However, the majority of validators and the Terra developer community agreed to the plan.
Other News About Crypto
- 🕠Bitcoin Pizza Day: May 22 is known as Bitcoin Pizza Day, the day that marks the first real-world transactions of goods purchased with the first decentralized digital currency, Bitcoin. On May 22, 2010 Laszlo Hanyecz, a developer and miner, stated that he is willing and ready to pay 10,000 BTC for two pizzas, if someone is willing to accept them. Bitcoin user Jeremy “Jercos” Sturdivant agreed to the terms, and two Papa John pizza pans arrived at Hanyecz’s house shortly after. With Bitcoin price hovering around US$30,000 this year, the two pizzas would be worth US$600 million now.
Reference
- Valdrin Tahiri, Determining Bitcoin’s (BTC) Correlation to the Dollar Index and the S&P 500, Be In Crypto, accessed on 23 Mei 2022
- Joseph Hall, Bitcoin Pizza Day rewind: A homage to weird and wonderful BTC purchases, Coin Telegraph, accessed on 23 Mei 2022
- Tom Mitchelhill, Ethereum devs tip The Merge will occur in August ‘if everything goes to plan’, Coin Telegraph, accessed on 23 Mei 2022
- Andrew Hayward, Universal Music Group to Release NFTs on LimeWire’s Algorand Marketplace, Decrypt, accessed on 23 Mei 2022.
- Kate Irwin, Terra Community Divided on Do Kwon’s ‘Authoritarian’ Hard Fork Proposal, Decrypt, accessed on 23 Mei 2022.
Share
Related Article


See Assets in This Article
BTC Price (24 Hours)
Market Capitalization
-
Global Volume (24 Hours)
-
Circulating Supply
-