Market Analysis May 6th, 2024: Bitcoin Holds Steady Near $60k

Bitcoin has experienced considerable volatility in recent weeks, influenced by a range of negative sentiments including Fear, Uncertainty, and Doubt (FUD) stemming from news about the former Binance CEO CZ receiving a four-month prison sentence, as well as ETF inflows that have yet to reach levels seen at the start of 2024. Despite these challenges, BTC has demonstrated resilience by rebounding to the $63K price range after dipping below $60K. Can BTC sustain its bullish momentum? Check out the analysis below.
As usual, the Pintu trading team has gathered critical information and analyzed the general economic situation and the crypto market’s movements over the past week. However, it should be noted that all information in this Market Analysis is intended for educational purposes, not as financial advice.
Market Analysis Summary
- ✍🏻 BTC should keep the next important resistance level at $61,500.
- 📈 The core PCE price index saw a 2.8% increase from March of the previous year, holding steady from February and slightly surpassing expectations.
- 🟢 The outlook for the US economy remains favorable amid concerns over the Presidential election in the United States and geopolitical issue.
- 📉 The Job Openings and Labor Turnover Survey (JOLTS) on Wednesday last week showed a decline of 325,000.
- 👀 The Federal Reserve is waiting for signs of a weakening labor market before considering a rate cut.
Macroeconomic Analysis
Fed Still Undecided on Interest Rate Cut amid Positive Core & Headline PCE
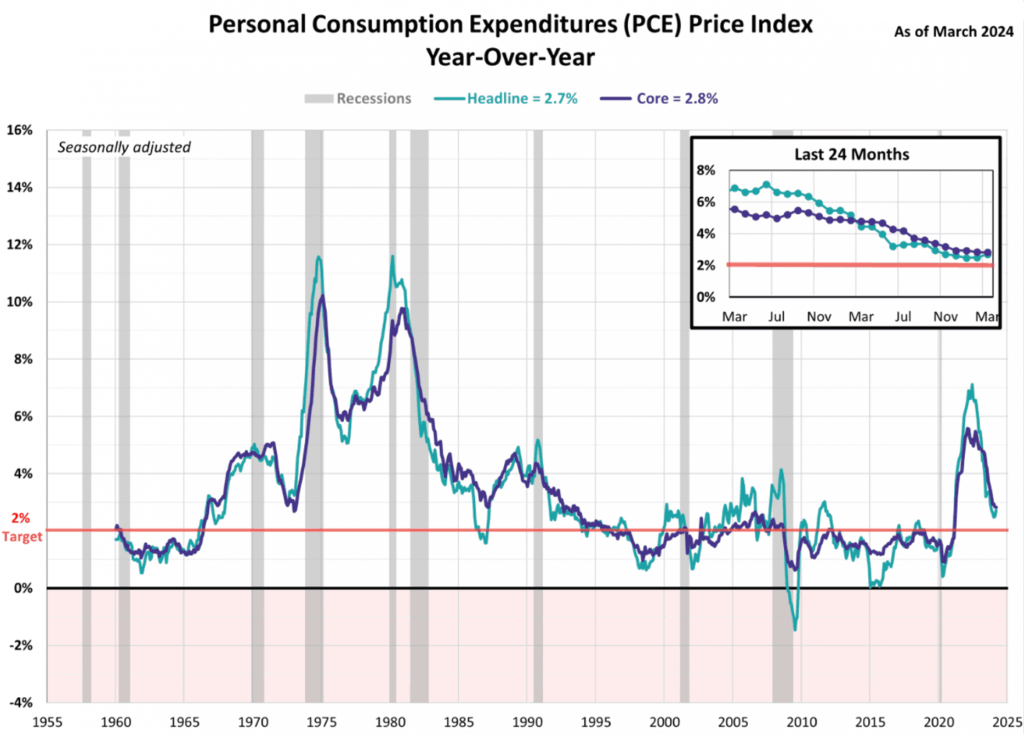
In March, the Fed’s preferred measure of inflation exceeded expectations. The Core Personal Consumption Expenditures (PCE) Price Index, which tracks inflation by excluding volatile food and energy prices, maintained a 2.8% increase compared to the previous year, consistent with February’s figures. Forecasts had anticipated a slight slowdown in inflation to 2.6% last month, in line with its steady trend over the past year.
Despite the higher-than-expected results, the core PCE index remains at its lowest level in the past three years. Furthermore, the headline PCE, which includes all items, continued its upward trend for the second consecutive month, rising from 2.5% in February to 2.7% in March. This surpassed the projected growth of 2.6%. Monthly data showed both headline and core PCE increasing by 0.3% from February, as predicted.
Other Economic Indicators
- Personal Income and Personal Spending U.S: While goods prices increased in the US, consumers maintained sustainable purchasing power. Personal spending rose 0.8%, outpacing the 0.5% increase in personal income. Despite positive purchasing power, the personal savings rate fell by 3.2%, indicating that households tapped into savings to maintain spending levels.
- Michigan Consumer Sentiment: The Michigan Consumer Sentiment Index dipped slightly in April to 77.2, a 2.8% decline from March. This reading remains within a narrow range of 2.5 points over the past year, suggesting a consistent economic outlook. However, internal and external factors are eliciting mixed responses from consumers. The upcoming US Presidential election is a particular concern, while geopolitical tensions, though escalating, are seen as less of a threat. Consumer attitudes are closely monitored because they influence roughly 70% of the economy.
- ADP Employment Report: According to the ADP employment report, April saw the addition of 192,000 nonfarm private jobs, indicating a slowdown compared to the 208,000 private jobs added in March. Surpassing expectations, this figure was higher than the anticipated 179,000 new private jobs. Forecasts for the upcoming BLS report suggest an addition of 180,000 private nonfarm jobs in April. However, for the full nonfarm job count (the PAYEMS number), projections anticipate the addition of 243,000 jobs. Below is a visualization depicting the trends of both series over the past twelve months.
- S&P Global Manufacturing and ISM Manufacturing PMI: In April, the S&P Global US Manufacturing PMI™ fell slightly to 50.0 from 51.9 in March, halting the three-month upward trend. Similarly, the ISM Manufacturing PMI also dipped to 49.2 from 50.3. This stagnation in business conditions, marking the first four months without improvement, signals a slow start to the second quarter for manufacturers. Declining orders, particularly for intermediate goods, have left factories dependent on existing backlogs to maintain operations. However, consumer goods manufacturers reported strengthening demand, indicating an ongoing recovery in the consumer sector of the economy.
- JOLTs Job Opening: According to the Wednesday release of the Job Openings and Labor Turnover Survey (JOLTS) by the US Bureau of Labor Statistics (BLS), on the last business day of March, the number of job openings stood at 8.488 million. This figure marked a decrease of 325K from March’s revised count of 8.813 million (initially reported as 8.756 million) and fell below the market’s expectation of 8.680 million.
- Fed Interest Decision: Last week, the US Federal Reserve decided to hold interest rates steady, signaling a possible future cut in borrowing costs. However, the Fed expressed concern about recent disappointing inflation figures, suggesting a potential delay in the rate reduction. While Chair Jerome Powell downplayed the likelihood of a near-term hike, he opted to maintain the benchmark rate in the 5.25%-5.50% range set in July. Investors in Fed-linked contracts are now anticipating rate cuts to begin by September.
- Initial Jobless Claim: In the week ending April 27, the US Department of Labor published weekly data indicating 208,000 initial jobless claims. This figure remained unchanged from the previous week’s revised count of 208,000 and surpassed market expectations of 212,000. Further insights from the report revealed that the advance seasonally adjusted insured unemployment rate stood at 1.2%, while the 4-week moving average decreased by 3,500 from the unrevised average of the previous week, settling at 210,000. The continuing jobless claim number during the week ending April 20 was 1,774,000, remaining unchanged from the revised level of the previous week.
BTC Price Analysis
Bitcoin’s price continued its decline below the $60,000 mark, signaling a short-term shift to bearish sentiment. The cryptocurrency even dipped below $58,000 before encountering support around $56,350.
A bottom was established at $56,378, initiating a moderate recovery trend. The price surpassed the $58,000 resistance area and broke through a significant bearish trend line with resistance at $57,800 on the BTC/USD chart.
Immediate resistance is anticipated near the $60,000 level, followed by a significant hurdle at $60,500, near the 50% Fibonacci retracement level of the decline from the $64,738 peak to the $56,378 low. Subsequently, the next notable resistance level lies at $61,500.

On-Chain Analysis
- 📊 Exchange: As the exchange reserve continues to rise, it indicates higher selling pressure. Net deposits on exchanges are low compared to the 7-day average. Lower deposits can be interpreted as lower selling pressure.
- 💻 Miners: Miners’ are selling holdings in a moderate range compared to its one-year average. Miner’s revenue is in a moderate range, compared to its one-year average.
- 🔗 On-Chain: More investors are selling at a profit. In the middle of a bull market, it can indicate a market top. Long term holders’ movement in the last 7 days were lower than the average. They have a motive to hold their coins. Investors are in anxiety phase where they are currently in a state of moderate unrealized profits.
- 🏦 Derivatives: Long position traders are dominant and are willing to pay to short traders. Buying sentiment is dominent in the derivatives market. More buy orders are filled by takers. As OI decreases, it indicates investors are closing futures positions and possibility of trend reversals. In turn, this might trigger the possibility of long/short-squeeze caused by sudden price movement or vice versa.
- 🔀 Technicals: RSI indicates a neutral condition. Stochastic indicates a neutral condition where the current price is in a moderate location between the highest-lowest range of the last 2 weeks.
News About Altcoins
- FriendTech Token Price Plummets Post-Launch. The price of the FriendTech token has significantly dropped from $10 to $1. Although briefly traded at $169, it currently sits at $1.4. This decline is attributed to issues with claiming the airdrop, causing frustration among users due to difficulty accessing their tokens. Other speculation suggests liquidity issues may have exacerbated the price drop, despite current liquidity reaching over $4 million. FriendTech itself is a platform known for its decentralized social network. Recently, FriendTech introduced its second version with the ‘Clubs’ feature, where community spaces are transacted in Friend tokens with a 1.5% fee given to liquidity providers
News from the Crypto World in the Past Week
- BlackRock Reveals Potential Entry of Sovereign Wealth Funds and Pension Funds into Bitcoin ETFs. BlackRock, the world’s largest asset manager, sees significant potential for sovereign wealth funds, pension funds, and foundations to enter the spot Bitcoin ETF market. This interest from these institutions in Bitcoin, according to BlackRock’s Head of Digital Assets, Robert Mitchnick, has sparked discussions. Over the past few years, BlackRock has been actively educating these institutions about Bitcoin.
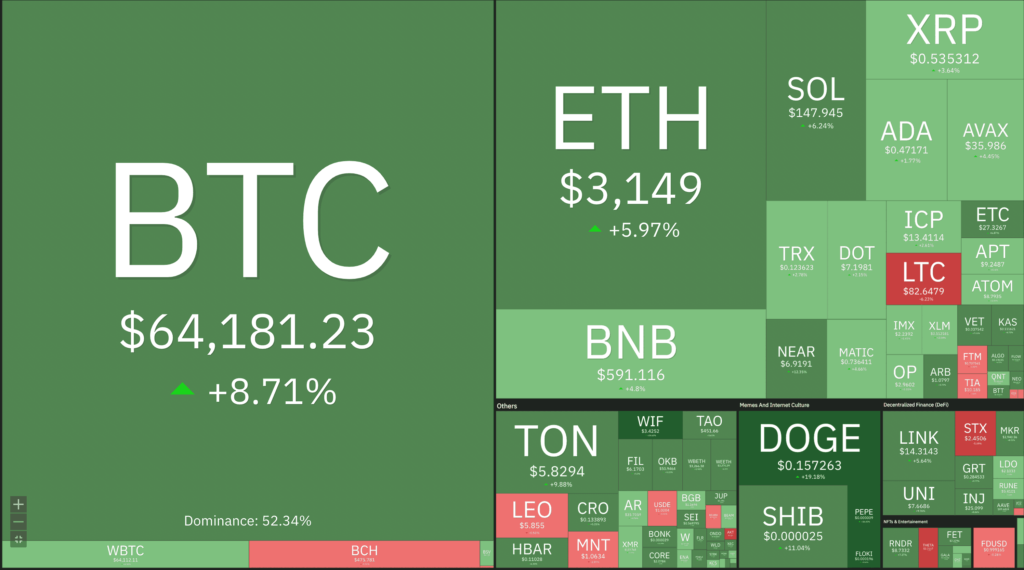
Cryptocurrencies Market Price Over the Past Week
Cryptocurrencies With the Best Performance
- Helium (HNT) +36.66%
- Pepe (PEPE) +32.54%
- Wormhole (W) +31.98%
- dogwifwhat (WIF) +30.61%
Cryptocurrencies With the Worst Performance
- Sui -6.44%
- Pendle -4.17%
- Gnosis -3.84%
- Pyth Network -3.23%
References
- Ian Allison, BlackRock Sees Sovereign Wealth Funds, Pensions Coming to Bitcoin ETFs, Coindesk, accessed on 4 May 2024.
- Brian McGleenon, FriendTech token price declines post-launch amid claim issues, theblock, accessed on 4 May 2024.
Share
Related Article


See Assets in This Article
BTC Price (24 Hours)
Market Capitalization
-
Global Volume (24 Hours)
-
Circulating Supply
-