Market Analysis Nov 13th, 2023: BTC & ETH Share the Sharp Rise

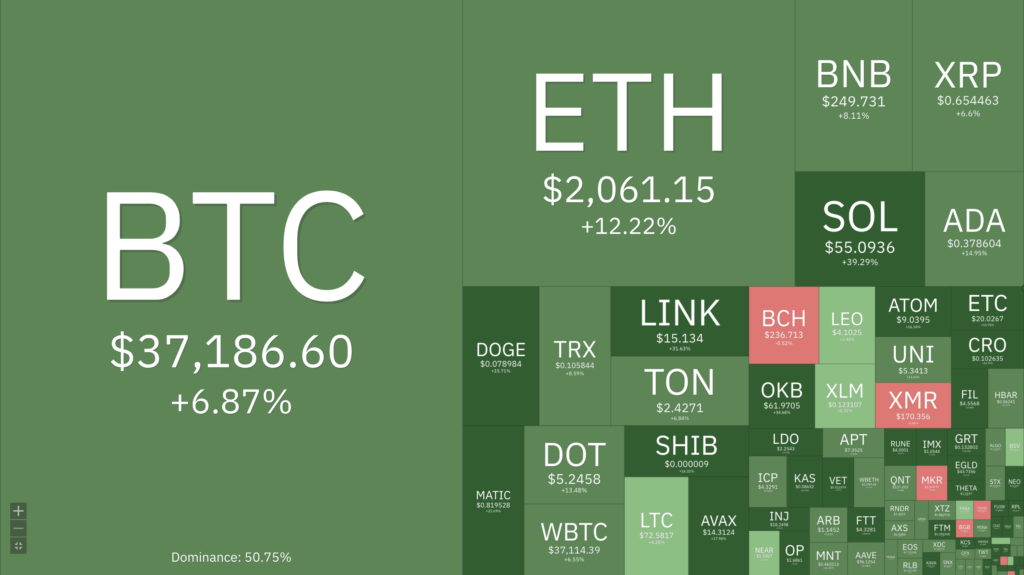
At the beginning of November, the price of bitcoin rose to $37,000, followed by a rise in Ethereum touching $2,000, marking its highest level since April. Will this upward trend continue? Find the analysis below.
As usual, the Pintu trading team has gathered critical information and analyzed the general economic situation and the crypto market’s movements over the past week. However, it should be noted that all information in this Market Analysis is intended for educational purposes, not as financial advice.
Market Analysis Summary
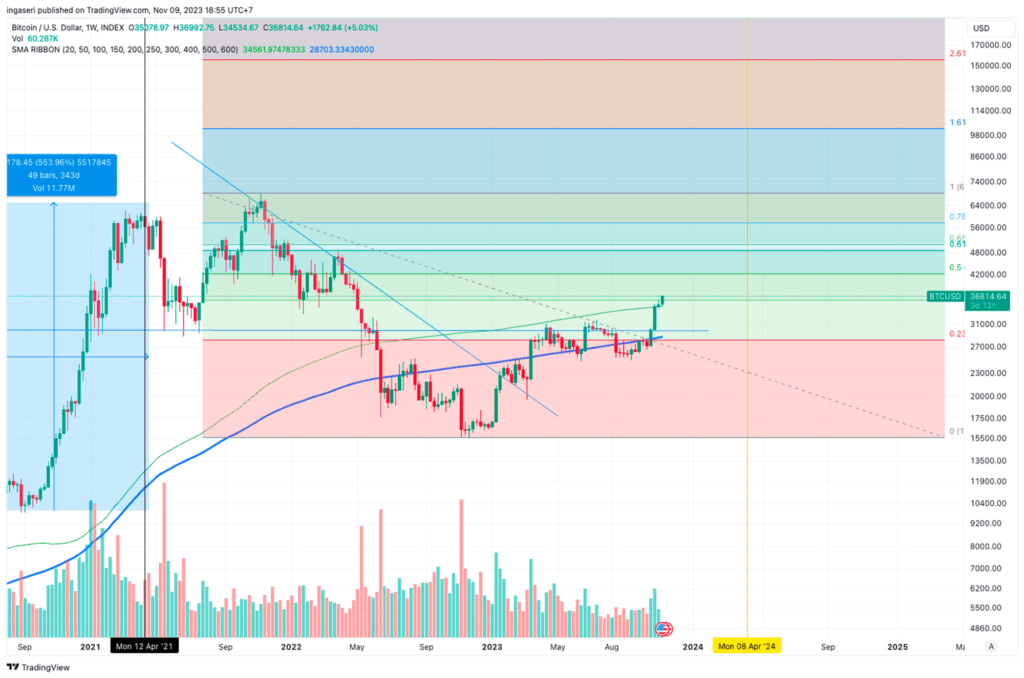
- 🚀 BTC has broken through the 0.382 Fibonacci retracement resistance level. There is potential for a significant rise in BTC prices.
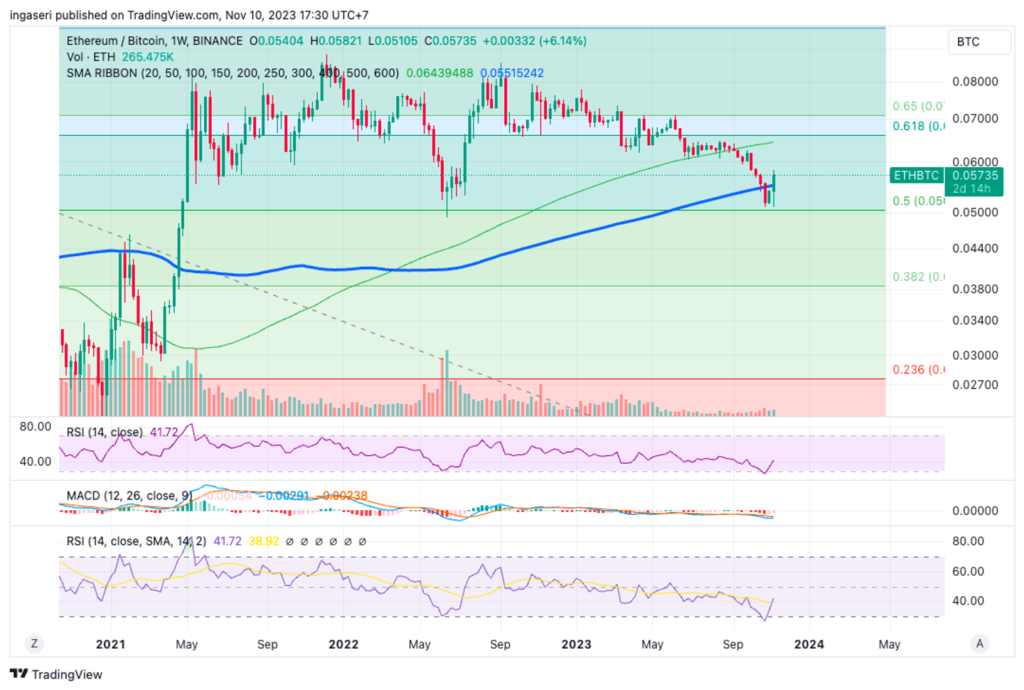
- 🦾 ETH has broken through the 200-week moving average (MA) resistance line. If it can sustain the rise, it is predicted to outperform BTC.
- 🟢 The U.S. GDP in the third quarter of 2023 recorded an annual growth of 4.9%.
- 👥 Meanwhile, the unemployment rate in the United States increased to 3.9%, and the number of benefit recipients rose for seven consecutive weeks, reaching 1.834 million.
Macroeconomic Analysis
U.S. Labor Sector
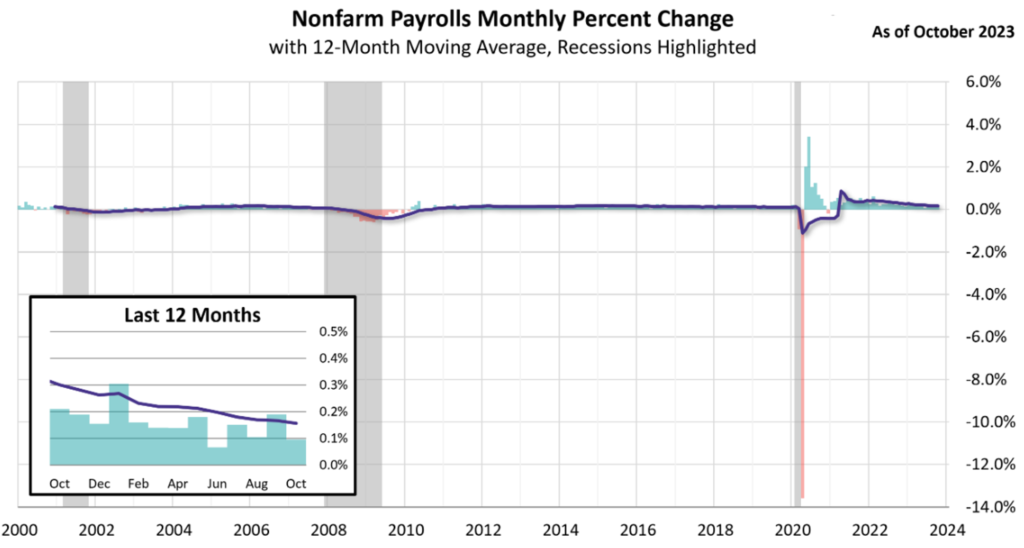
The U.S. economic report for October indicates slower economic growth and a cooling job market. This report reinforces the financial market’s confidence that the Fed has completed its interest rate hikes for this cycle. It has also increased confidence that the U.S. central bank has successfully guided the economy toward a “soft landing,” rather than risking a recession, as feared by some economists.
Here are some other indicators analyzed to provide an overview of the overall macroeconomic situation.
Other Economic Indicators
- Employment: According to the latest employment data, there were 150,000 new jobs in October, below the expected 180,000 new positions. Meanwhile, the unemployment rate increased to 3.9%.
- Gross Domestic Product (GDP): The U.S. GDP in the third quarter of 2023 showed strong performance with an annual growth of 4.9%. However, additional data indicates a weakening in economic activity.
- S&P Global Services PMI: The S&P Global Services Purchasing Managers’ Index (PMI) for October came in at 50.6, slightly below the expected 50.9. Nevertheless, the latest reading marks the ninth consecutive month that the index has remained in expansion territory. This PMI survey presents a relatively weaker perspective on the health of the U.S. economy compared to the recently released GDP figures.
- ISM Services PMI Index: ISM reported that the non-manufacturing PMI fell to 51.8 in October, the lowest level in the past five months, indicating a contraction in the service sector.
- Initial Jobless Claims: Initial claims for state unemployment benefits fell slightly last week to 217,000 from 220,000, suggesting that layoffs remain low despite some signs of a cooling labor market. However, the number of people receiving benefits has risen for seven consecutive weeks to 1.834 million. This increase is the highest since April, suggesting that it is becoming more difficult for the unemployed to find new jobs.
BTC & ETH Price Analysis
Bitcoin
Over the week, we have seen price fluctuations in BTC. This suggests a contest between sellers and buyers near the crucial $35,000 resistance zone, leading to a period of consolidation with minor fluctuations. Nevertheless, towards the end of the week, we see a bullish breakthrough above this level. BTC has surpassed the 0.382 Fibonacci retracement level, which had acted as a resistance in the previous week. If we manage to maintain a closing price above $36,000 this week, there is a possibility of triggering a significant upward trend and we will witness the establishment of a new price range for BTC.
The Long-Term Holder metric, referring to addresses holding Bitcoin for at least 155 days, is approaching an all-time high, while the Short-Term Holder metric, encompassing addresses holding coins for less than 155 days, is nearing an all-time low. This suggests a tightening of Bitcoin supply.
While the long-term outlook appears favorable, there may be significant developments in the short term. The Bitcoin derivatives markets have witnessed a substantial accumulation of open interest, currently exceeding $16 billion according to CoinGlass data. Instances of open interest exceeding $12.2 billion have previously led to a minimum decline of 20%.
Ethereum
ETH is demonstrating remarkable performance compared to BTC, boasting a lead of over 6% against BTC in the past week. We have successfully surpassed the 200-week moving average (MA) resistance line after spending two weeks below it. If we can maintain this upward trend and close above the resistance line by the end of the week, it is anticipated that ETH will continue to outperform BTC.
On-Chain Analysis
- 📊 Exchange: As the exchange reserve continues to rise, it indicates higher selling pressure. Net deposits on exchanges are low compared to the 7-day average. Lower deposits can be interpreted as lower selling pressure.
- 💻 Miners: Miners’ are selling holdings in a moderate range compared to its one-year average. Miner’s revenue is in a moderate range, compared to its one-year average.
- 🔗 On-Chain: More investors are selling at a profit. In the middle of a bull market, it can indicate a market top. Long term holders’ movement in the last 7days was lower than the average. They have a motive to hold their coins. Investors are in an Anxiety phase where they are currently in a state of moderate unrealized profits.
- 🏦 Derivatives: Long position traders are dominant and are willing to pay to short traders. Selling sentiment is dominant in the derivatives market. More sell orders are filled by takers. As open interest increases, it indicates more liquidity, volatility, and attention are coming into the derivative market. The increasing trend in open interest could support the current ongoing price trend.
- 🔀 Technicals: RSI indicates an overbought condition where 77.00% of price movement in the last 2 weeks have been up and a trend reversal can occur. Stochastic indicates a neutral condition where the current price is in a moderate location between the highest-lowest range of the last 2 weeks.
News About Altcoins
- Solana experienced an impressive 22% surge, breaking through the $54 mark for the first time since May 2022. Despite the ongoing sale of 55.75 million SOL tokens by the bankruptcy of FTX, investors remained enthusiastic about the SOL price increase. This enthusiasm is partly due to the fact that some of the tokens from the bankruptcy process are either vested or locked, with a weekly sale limit of $100 million as part of FTX’s liquidation plan. This surge led to a 39% weekly increase for SOL, pushing its futures open interest to $745 million, the highest since its all-time high in November 2021.
News from the Crypto World in the Past Week
- Nasdaq has filed for BlackRock’s proposed iShares Ethereum Trust ETF, signaling the world’s largest asset manager’s interest in crypto assets. The filing was made on a Thursday, shortly after BlackRock registered an entity in Delaware. This move towards a spot ether ETF is in line with BlackRock’s increasing involvement in the crypto space. The filing is currently awaiting a decision from the U.S. Securities and Exchange Commission on a similar application for a spot bitcoin ETF. According to the filing, the proposed Ether ETF would use Coinbase Custody Trust Company as its custodian and base its value on the CME CF Ether-Dollar Reference Rate – New York Variant.
- SEC Chairman Gary Gensler, in his statement at the DC Fintech Week, mentioned that a renewed FTX could be viable if operated in accordance with the law. Gensler’s statement was in response to reports of a possible acquisition of the FTX crypto exchange by Tom Farley, former president of the New York Stock Exchange. Gensler emphasized the importance of conducting business legally, making accurate disclosures, and avoiding conflicts of interest such as those seen between FTX and Alameda Research. The SEC and CFTC have filed civil actions against FTX following the guilty plea of Sam Bankman-Fried, the founder of FTX, to various criminal charges, including fraud and money laundering. Gensler also reiterated that existing securities laws are robust enough for the crypto industry and need to be enforced.
Cryptocurrencies Market Price Over the Past Week
Cryptocurrencies With the Best Performance
- Blur (BLUR) +49,35%
- Celestia (TIA) +42,05%
- Immutable +40,98%
- Solana +34,57%
Cryptocurrencies With the Worst Performance
- Maker (MKR) -2,86%
- Bitcoin Cash (BCH) -0,73%
- Stellar -0,26%
References
- Marcel Pechman, Solana price hits a new 2023 high — What’s behind the SOL rally?, Cointelegraph, accessed on 11 November 2023.
- Sarah Wynn, Nasdaq files for BlackRock’s proposed iShares Ethereum Trust ETF, theblock, accessed on 11 November 2023.
- MacKenzie Sigalos, SEC Chair Gensler says rebooted FTX run by ex-NYSE chief is possible if done ‘within the law’, Cnbc, accessed on 11 November 2023.
Share
Related Article


See Assets in This Article
0.9%
2.4%
0.0%
0.0%
0.0%
BTC Price (24 Hours)
Market Capitalization
-
Global Volume (24 Hours)
-
Circulating Supply
-