Market Analysis Oct 14th, 2024: Vitalik Buterin Profits from Memecoin, BTC’s Rally Remains Uncertain

The direction of Bitcoin at the start of the fourth quarter remains uncertain, as the ongoing battle between “bears” and “bulls” continues. From a macroeconomic perspective, however, there is a positive data that could potentially contribute to the rise in crypto prices. Please find our analysis below.
Market Analysis Summary
- 📝 BTC is trading below the 200-day MA at $63,400 and is hovering around the 100-day MA at approximately $61,000.
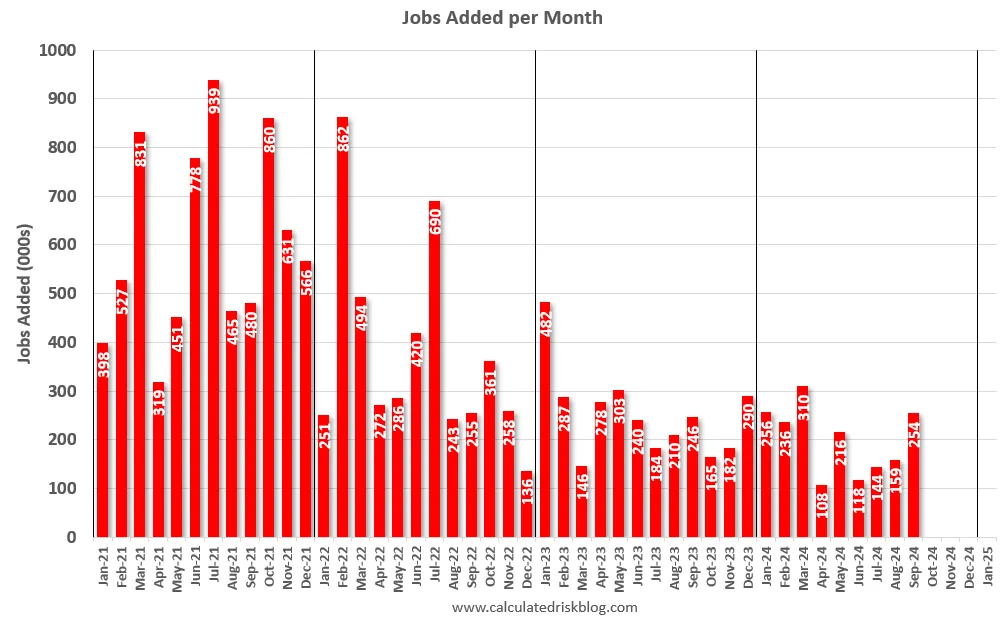
- 💼 Total nonfarm payroll employment increased by 254,000 in September.
- 🟢 The unemployment rate remained relatively unchanged at 4.1 percent.
- ✅ Majority of US Fed officials last month backed a half-point rate cut as an initial step towards a more accommodative monetary policy.
Macroeconomic Analysis
Non-farm payroll
According to the U.S. Bureau of Labor Statistics report released today, total nonfarm payroll employment increased by 254,000 in September, while the unemployment rate remained relatively unchanged at 4.1 percent. Employment continued to trend upward in several sectors, including food services and drinking places, health care, government, social assistance, and construction.
The total nonfarm payroll employment change for July was revised upward by 55,000, from +89,000 to +144,000, while the change for August was adjusted upward by 17,000, from +142,000 to +159,000. As a result of these revisions, employment for July and August combined is now 72,000 higher than initially reported.
Other Economic Indicators
- Unemployment Rate: The unemployment rate fell to 4.1% in September, down from 4.2% in August. This figure exceeded consensus expectations, and the payroll numbers for July and August were collectively revised upward by 72,000 jobs.
- Fed Minutes: According to the minutes from the two-day policy meeting released on Wednesday, a substantial majority of US Fed officials last month backed a half-point rate cut as an initial step towards a more accommodative monetary policy.
- Initial Jobless Claim: The number of Americans filing for unemployment benefits jumped by 33,000 to 258,000 in the week ending October 5, according to the Labor Department on Thursday. This marks the highest level of initial claims since early August 2023.
- CPI: Consumer prices increased by 2.4 percent over the year through September, slightly down from the previous month. While the slowdown was less than economists had anticipated, there was positive news regarding housing costs. Excluding food and fuel costs, which can fluctuate significantly, the “core” inflation measure edged up slightly to 3.3 percent, compared to 3.2 percent previously.
BTC Price Analysis
October has not yet delivered the anticipated gains. At the beginning of the week, the outlook was promising as BTC surged to over $64,400. However, this increase was short-lived, and the cryptocurrency began to decline almost immediately.
By Wednesday, it had fallen to $62,000, with bears maintaining pressure and pushing it further down to $60,400 on Thursday morning. The situation worsened in the evening when BTC dropped by several thousand more, reaching a multi-week low of $58,800. This sharp decline led to approximately $250 million in liquidations over the day.
Despite this, the bulls stepped in at this point and prevented further declines. In fact, BTC has since rebounded by nearly $2,000, currently trading around $61,000.
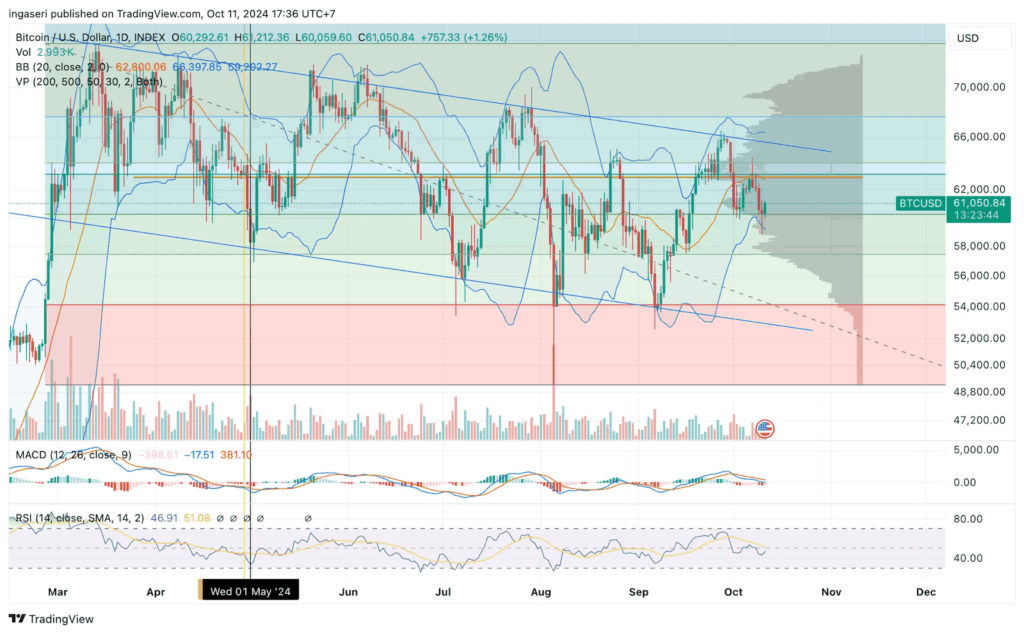
BTC’s rise above the 100-day and 200-day MA briefly reignited bullish sentiment. However, upon reaching the $66,000 resistance zone, significant selling pressure emerged, halting the upward movement. This level has historically been a strong multi-month resistance, and BTC’s inability to break through led to a sharp rejection.
Currently, BTC is trading below the 200-day MA at $63,400 and is hovering around the 100-day MA at approximately $61,000. This area is crucial, as the $60,000 support level is both a psychological and significant barrier. If it falls below this support, a mid-term decline toward the $52,000-$55,000 range becomes a likely scenario. This range represents the next major support level and could be the target if bearish momentum persists.
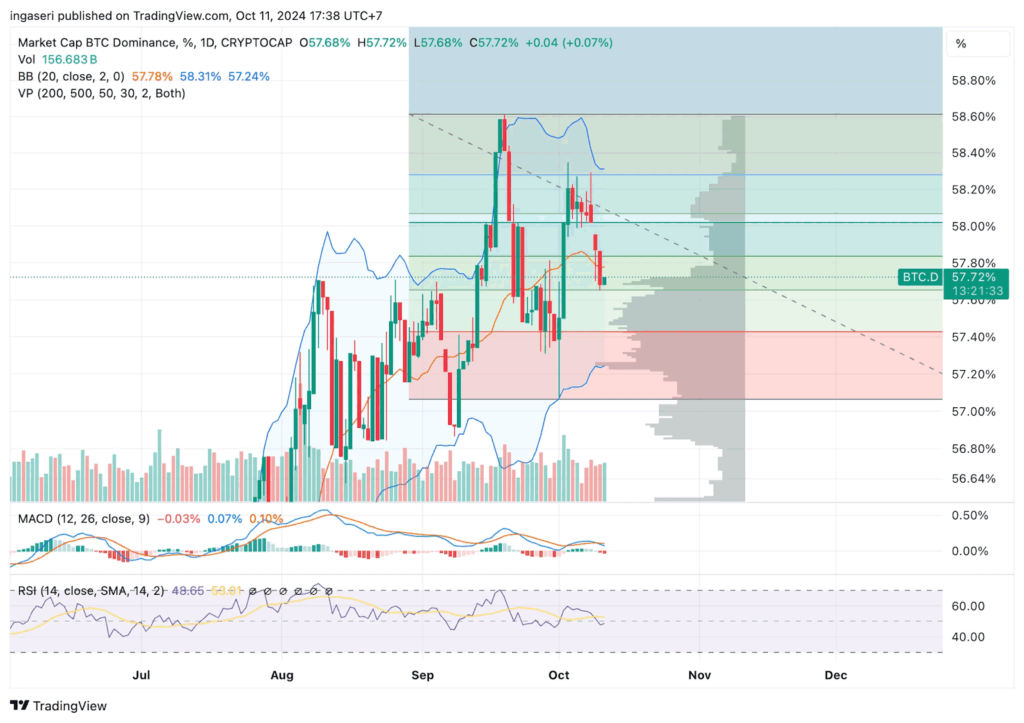
BTC dominance has also declined, dropping to 57.7%. As BTC is struggling to break key resistance levels, market participants may view this as an opportunity to invest in other coins that show greater momentum or growth potential.
On-Chain Analysis
- 📊 Exchange: As the exchange reserve continues to fall, it indicates lower selling pressure. Net deposits on exchanges are high compared to the 7-day average. Higher deposits can be interpreted as higher selling pressure.
- 💻 Miners: Miners’ are selling holdings in a moderate range compared to its one-year average. Miner’s revenue is in a moderate range, compared to its one-year average.
- ⛓️ On-chain: More investors are selling at a profit. In the middle of a bull market, it can indicate a market top. Long term holders’ movement in the last 7days were lower than the average. They have a motive to hold their coins. Investors are in a anxiety phase where they are currently in a state of moderate unrealized profits.
- 🏦 Derivative: Long position traders are dominant and are willing to pay to short traders. Selling sentiment is dominant in the derivatives market. More sell orders are filled by takers. As open interest increases, it indicates more liquidity, volatility, and attention are coming into the derivative market. The increasing trend in OI could support the current ongoing price trend.
- 🔀 Technicals: RSI indicates a neutral condition. Stochastic indicates a neutral condition where the current price is in a moderate location between the highest-lowest range of the last 2 weeks.
News About Altcoins
- Ethereum Co-Founder Vitalik Buterin Cashes in on Meme Coin Gifts, Earning $2.24 Million. Vitalik Buterin, the co-founder of Ethereum, recently earned $2.24 million from selling various meme coins that he had received as gifts from developers. Over a series of transactions spanning 12 hours, Vitalik converted meme tokens such as $MOODENG, $MSTR, $EBULL, $POPCAT, $MILO, $FWOG, $TCATI, and $VITALIK into 908.77 $ETH. The largest sale involved 10 billion $MOODENG, which brought in 395.96 $ETH, or nearly $976,000. This is not the first time Vitalik has sold meme coins; in 2021, he sold Shiba Inu ($SHIB) and donated part of the proceeds to charity.
News from the Crypto World in the Past Week
- Todd Denies Satoshi Claims. A new HBO documentary has claimed to reveal the identity of Satoshi Nakamoto, the mysterious creator of Bitcoin, to Canadian crypto guru Peter Todd. However, Todd has vehemently dismissed the claims as “ridiculous.” In the documentary, “Money Electric: The Bitcoin Mystery,” Todd is presented with evidence suggesting he is Satoshi. Despite this, he firmly denies any involvement. Satoshi Nakamoto’s identity has remained a mystery for years, and their estimated $69 billion fortune has only fueled the intrigue. Various individuals have previously been claimed to be Satoshi, but all of those claims, including one from Craig Wright, have been debunked or proven false.
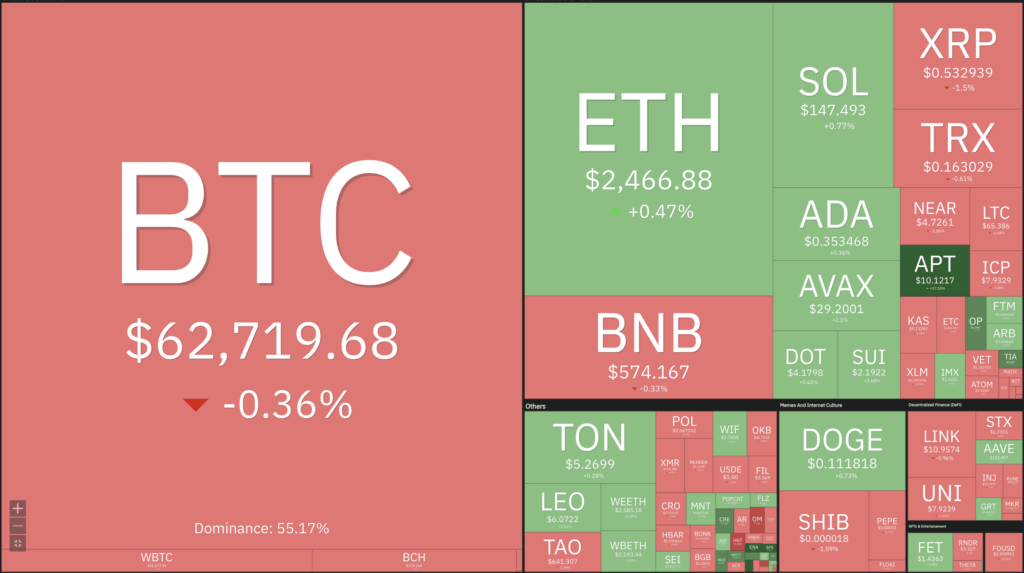
Cryptocurrencies Market Price Over the Past Week
Cryptocurrencies With the Best Performance
- First Neiro On Ethereum (NEIRO) +107,21%
- Sui +27,39%
- Brett (BRETT) +22,33%
- Chiliz 20,70%
Cryptocurrencies With the Worst Performance
- Helium 12,23%
- Kaspa -9,70%
- Maker (MKR) -8,50%
- Wormhole (W) -7,85%
References
- Umair Younas, Vitalik Buterin Sells $2.24M in Memecoins within 12 Hours, blockchainreporter, accessed on 13 October 2024.
- Joe Tidy, Man denies being mysterious inventor of Bitcoin, bbc, accessed on 13 October 2024.
Share
Related Article


See Assets in This Article
3.3%
0.0%
0.0%
0.0%
0.0%
BTC Price (24 Hours)
Market Capitalization
-
Global Volume (24 Hours)
-
Circulating Supply
-