Market Analysis Oct 23rd, 2023: BTC Breaks $30K Resistance – Is This a Bullish Turn?

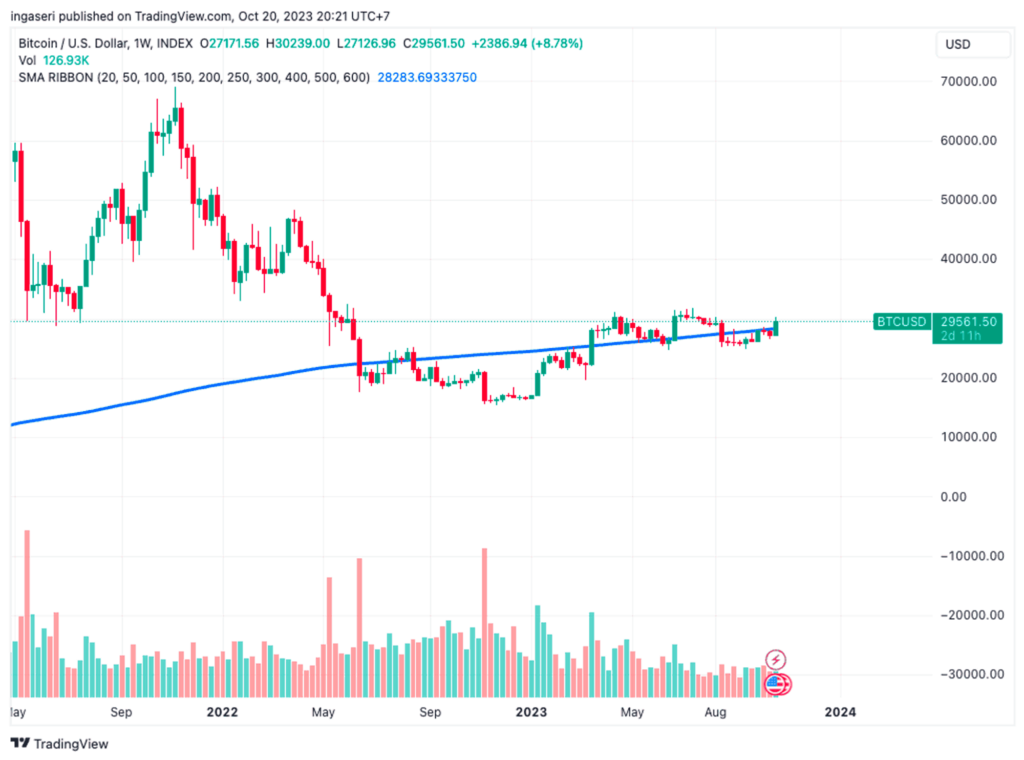
The previous week in the crypto market witnessed a series of interesting events, from a tweet from the Cointelegraph account that caused volatility in the price of bitcoin to Ripple’s three victories in a row over the Securities and Exchange Commission (SEC), which also helped boost positive sentiment. Since last week, BTC has increased 11%, suggesting that BTC has finally broken through the $30,000 resistance level. Do these factors mean that a bullish trend has already begun?
The Pintu trading team has gathered critical information and analyzed the general economic situation and the crypto market’s movements over the past week. However, it should be noted that all information in this Market Analysis is intended for educational purposes, not as financial advice.
Market Analysis Summary
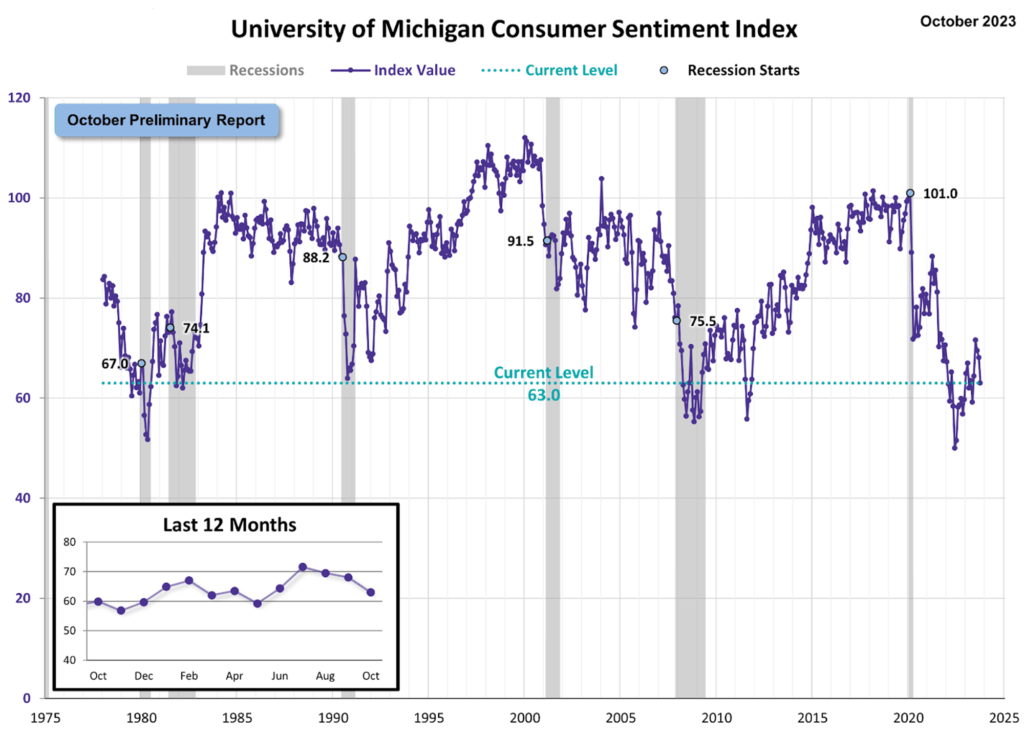
- 📉 The Michigan Consumer Sentiment Index fell from 68.1 to 63 in October. The decline was driven by signals of inflation in the coming year.
- 👥 There were 198,000 jobless claims, a decrease of 13,000 from the previous week and below the Dow Jones estimate of 210,000.
- 🦾 U.S. retail sales rose 0.7%, beating expectations for a 0.3% increase in September.
- 🟢 BTC successfully broke through the $30,000 resistance level, and if it manages to close above this level, it would create a strong momentum for this week.
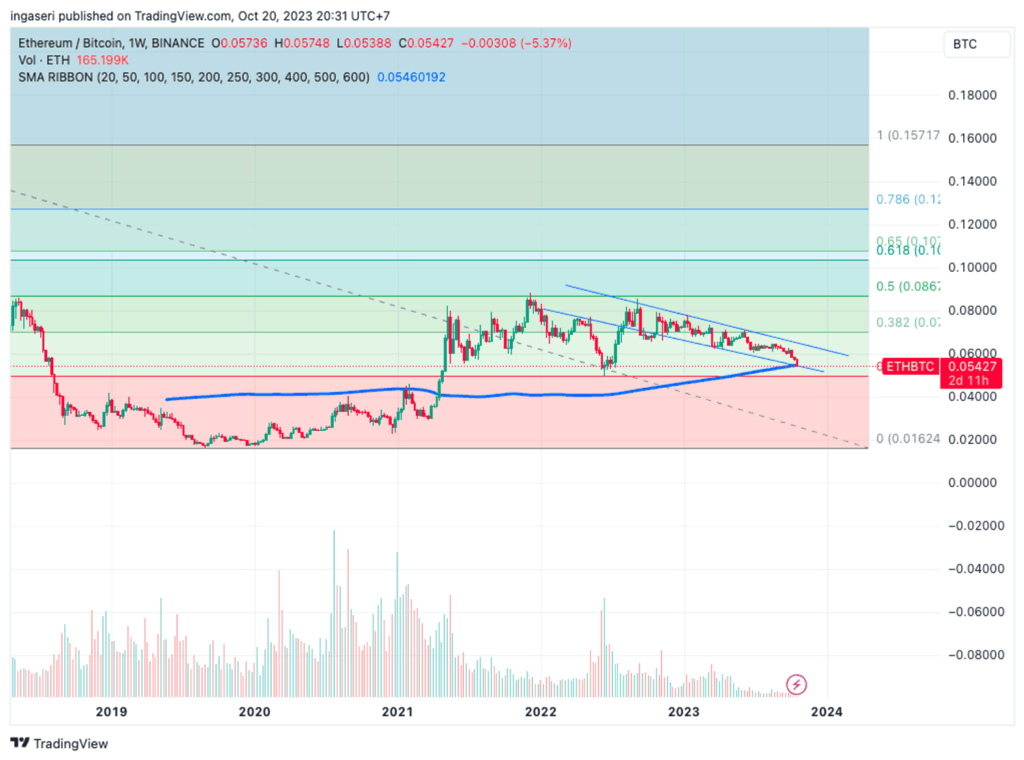
- ✍🏻 There are two scenarios for ETH after reaching the 200-week moving average (MA) support level. If it breaks this support and moves lower, it could trigger additional ETH selling. If the support holds, it will be a strong momentum for ETH compared to BTC.
Macroeconomic Analysis
Michigan Consumer Sentiment
The Michigan Consumer Sentiment opened with a decline in its initial reading for October, standing at 63.0 compared to 68.1 in September. This significant drop was fueled by concerns over high inflation expectations for the coming year. According to the survey, one-year inflation expectations rose to 3.8% in October from 3.2% in September.
Meanwhile, the five-year inflation forecast rose to 3.0% from 2.8% the previous month, remaining in a relatively narrow range between 2.9% and 3.1%, a pattern that has persisted for 25 of the past 27 months.
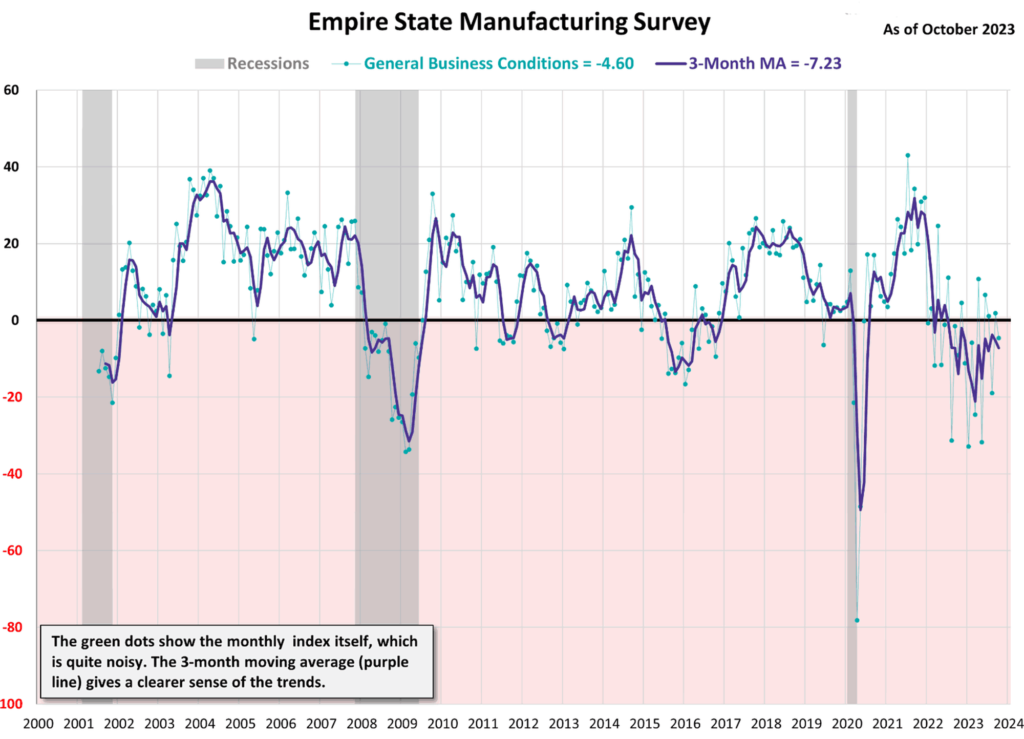
New York State Manufacturing Index
Manufacturing activity in New York State also declined. In the Empire State Manufacturing Survey, the diffusion index of general business conditions fell 6.5 points from the previous month to -4.6. This is better than the expected reading of -7.0 and moves the index back into contraction territory.
The Empire State Manufacturing Index assesses the relative condition of general business activity in New York State. Readings above 0.0 indicate improving conditions, while readings below 0.0 indicate deteriorating conditions. This data is derived from a survey of approximately 200 manufacturers in New York State.
Among labor market indicators, employment levels and the average workweek increased slightly. The rate of increase in input prices was unchanged from the previous month, while the rate of increase in selling prices was moderate. Looking ahead, managers maintained a relatively positive outlook for the next six months.
Retail Sales
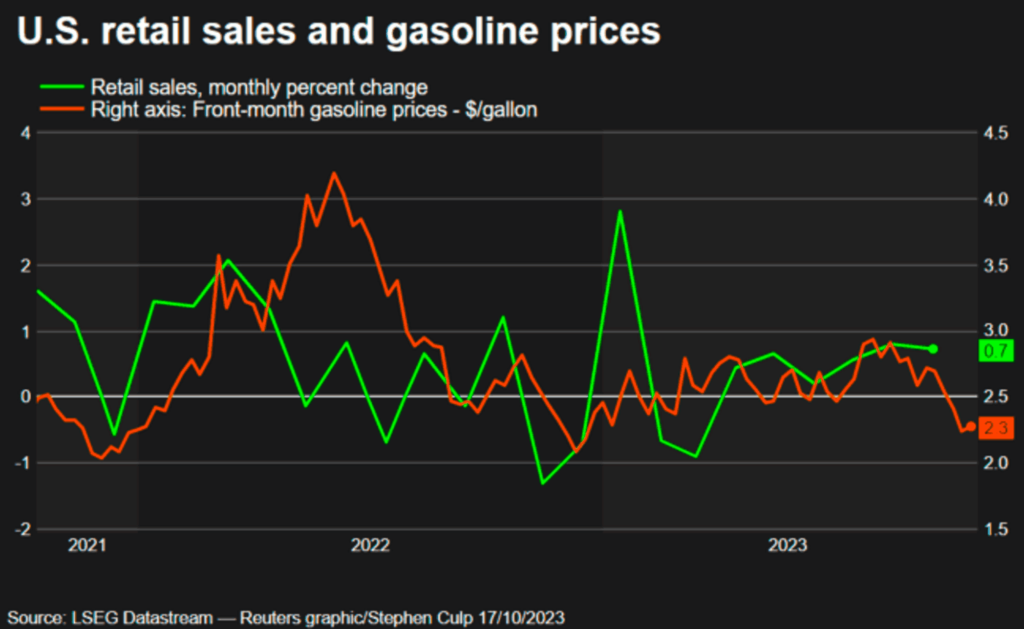
Similar to the employment indicators, U.S. retail sales rose 0.7% in September, beating expectations for a 0.3% gain. The increase was driven by a rise in consumer spending on automobiles and eating out at restaurants and bars. This development reinforces the belief that economic growth picked up significantly in the third quarter.
The resilience of the economy has allayed concerns about a potential recession in 2023. This continued strength is further underscored by additional data released on Tuesday (10/17), which showed a strong increase in factory output last month, even in the face of strikes in the auto industry.
It is important to note that retail sales primarily cover the sale of goods and are not adjusted for inflation. On a year-over-year basis, retail sales rose 3.8% in September.
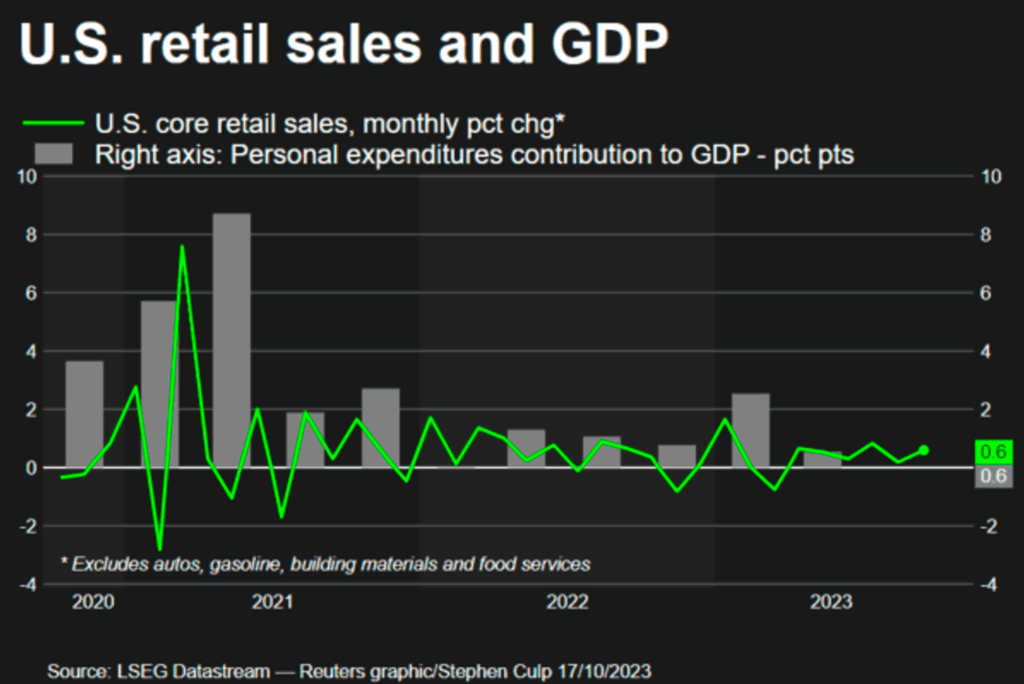
Excluding sales related to automobiles, gasoline, building materials, and food services, retail sales rose 0.6% in September. August’s data was revised upward to reflect a 0.2% increase in these core retail sales, compared to the 0.1% previously reported.
Core retail sales represent the consumer spending aspect of gross domestic product (GDP). Consumer spending is estimated to have increased in the third quarter, in part due to a jump in July. In addition, strong spending on services is expected to continue to contribute to overall consumption.
The U.S. economy expanded at a 2.1% pace in the second quarter as sales increased and business inventories rose. According to a separate report from the Commerce Department, business inventories rose 0.4% in August, the largest increase since last December, following a small 0.1% increase in July.
The string of positive economic reports continued with a third report from the Federal Reserve showing that manufacturing production rose 0.4% in September, rebounding from a slight 0.1% decline in August.
Increased demand for goods from consumers and businesses underscores the resilience of the economy. However, it also allows for higher price pressures as demand continues.
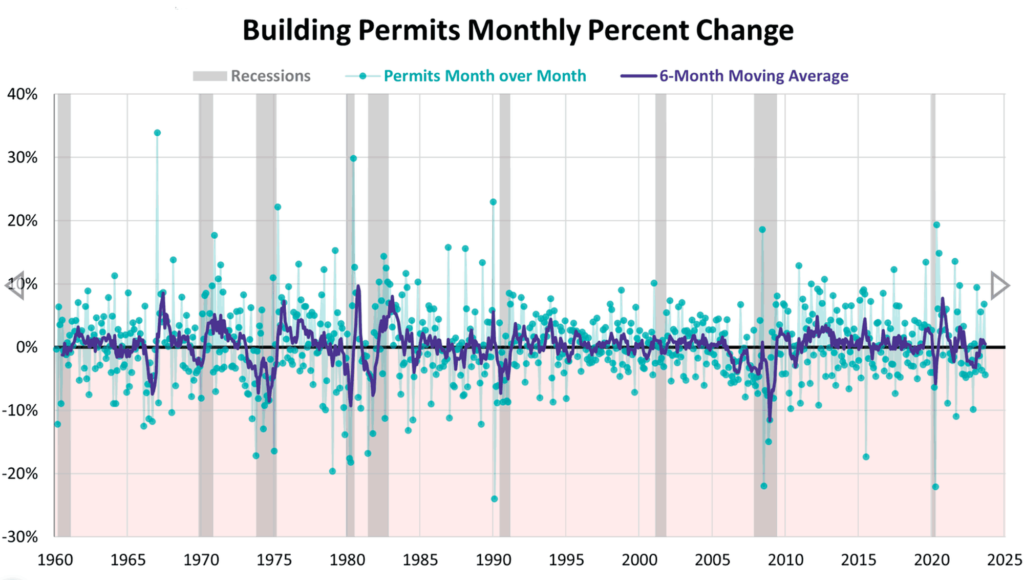
Building Permits
Residential construction experienced an increase that can be attributed to permits issued a few months prior to the recent rise in mortgage rates above 7%. The Commerce Department reported that single-family home construction, which makes up the majority of homebuilding activity, experienced a 3.2% increase, reaching an annual rate of 963,000 units last month. The number of homes permitted for construction but not yet started increased 0.7% to 281,000 units.
However, homebuilding also reflects a decline in new home construction to 933,000 units. In addition, permits for multifamily housing fell 14.0% to 459,000 units, the lowest level since October 2020. Overall, building permits, which include various types of construction, fell 4.4% to 1.473 million units.
Unemployment Claims
Initial claims for unemployment benefits fell last week, indicating that the U.S. labor market remains competitive, which could contribute to ongoing inflationary pressures.
As reported by the U.S. Department of Labor, for the week ending October 14th, there were 198,000 initial claims for unemployment benefits on a seasonally adjusted basis. These claims showed a decrease of 13,000 from the previous week and were below the Dow Jones estimate of 210,000. This is the lowest weekly level since January 21.
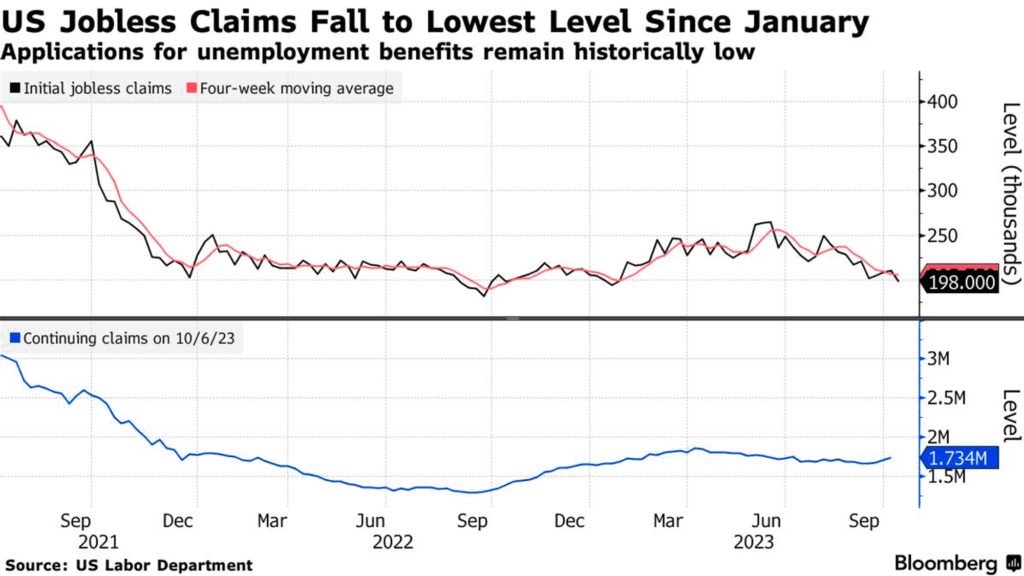
The following week, continuing claims reached 1.734 million, an increase of 29,000 from the previous week. This number exceeded the estimate of 1.698 million.
Labor market conditions play a critical role in the Federal Reserve’s monetary policy deliberations. Policymakers are concerned that a labor market that remains relatively tight could put upward pressure on prices, even after the central bank has raised interest rates 11 times, totaling 5.25 percentage points since March 2022.
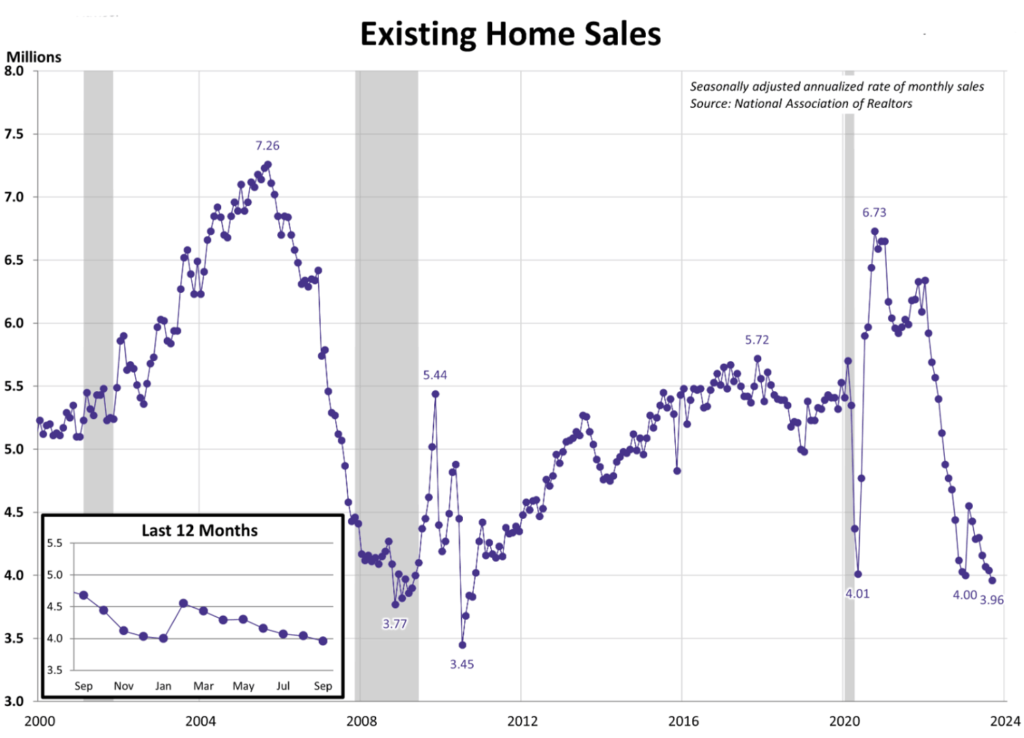
Existing home sales
According to the National Association of Realtors, existing home sales fell 2.0% last month to a seasonally adjusted annual rate of 3.96 million units. This is the lowest level since October 2010. Contributing factors include the rise in mortgage interest rates and limited housing supply, which together reduce housing affordability, especially for first-time homebuyers.
It is important to note that these sales are recorded at the contract closing stage, and last month’s sales likely reflect contracts signed in August. In August, mortgage rates, particularly for the popular 30-year mortgage, had risen above 7%.
BTC & ETH Price Analysis
The crypto market has finally gained momentum towards greater stability. BTC surged over 11% last week after a long battle to break through the $30,000 resistance level, signaling a potential bullish trend in the crypto market.
Recently, BlackRock has been actively working with the Securities and Exchange Commission (SEC) to expedite the approval process for Exchange Traded Funds (ETFs). As a result, it is expected that crypto ETFs will be approved soon, which could trigger a rally in the crypto market in the near future.
BTC recently experienced a brief period of price pressure due to retail investors trading with limited capital and high leverage. This resulted in price fluctuations characterized by rapid spikes followed by sharp declines.
On the charts, BTC has made a significant breakout as its price has surpassed historical resistance and support levels represented by the 200-week moving average. If BTC is able to maintain a closing price above $30,000, it may signal greater momentum for the week ahead.
ETH/BTC has reached the support level of the 200-week moving average. If ETH breaks this support and moves lower, it may trigger additional ETH selling. However, if the support holds, it may be an opportune time to take advantage of ETH’s momentum versus BTC.
On-Chain Analysis
- 📊 Exchange: As the exchange reserve continues to fall, it indicates lower selling pressure. Net deposits on exchanges are high compared to the 7-day average. Higher deposits can be interpreted as higher selling pressure.
- 💻 Miners: Miners’ are selling holdings in a moderate range compared to its one-year average. Miner’s revenue is in a moderate range, compared to its one-year average.
- 🔗 On-Chain: More investors are selling at a loss. In the middle of a bear market, it can indicate a market bottom. Long term holders’ movement in the last 7days were lower than the average. They have a motive to hold their coins. Investors are in an anxiety phase where they are currently in a state of moderate unrealized profits.
- 🏦 Derivatives: Short position traders are dominant and are willing to pay long traders. Selling sentiment is dominant in the derivatives market. More sell orders are filled by takers. As open interest increases, it indicates more liquidity, volatility, and attention are coming into the derivative market. The increasing trend in open interest could support the current ongoing price trend.
- 🔀 Technicals: The relative strength index (RSI) indicates a neutral condition. Stochastic indicates a neutral condition where the current price is in a moderate location between the highest-lowest range of the last 2 weeks.
News About Altcoins
- Based on a post by @polkaworld_org on October 19, as relayed by Joe Petrowski, a research analyst at Parity, Agile Coretime (Polkadot 2.0) is scheduled to launch on the Rococo testnet in late 2023. This will be followed by deployment on the Kusama canary network in the first three months of 2024, and finally on the Polkadot mainnet in the second quarter of 2024. This progress indicates that the project will gain direct access to Polkadot’s relay chain services, eliminating the need to acquire extended parachain slot leases.
- Scroll has launched its mainnet, showcasing its unique zkEVM, which is bytecode-level compatible with EVM and promises an almost identical experience to Ethereum. Following the launch, Scroll’s primary focus is on developing a decentralized proof network and sequencer, drawing parallels to zkSync’s strategy and indicating that potential airdrops and token issuances may take additional time. Since its mainnet launch on October 17th, Scroll’s Total Value Bridged (TVB) has increased significantly to over $7.58 million, with $6.07 million used in on-chain protocols.
News from the Crypto World in the Past Week
- Cointelegraph caused market volatility when it posted a tweet on Twitter stating that a spot bitcoin ETF had been approved by the SEC in the United States. Shortly thereafter, the tweet was deleted and it was confirmed that the news was not true. Later, on October 17, Cointelegraph published a full explanation of the incident, admitting that its editorial team had rushed to publish the report based on an alert received via Telegram, without verifying the credibility of the news source. The false news originated from an unverified screenshot shared by a user claiming to be from Bloomberg.
- Lightning Labs Successfully Deploys Taproot Assets, Enabling a Multi-Asset Bitcoin Network. Lightning Labs has successfully deployed the Taproot Assets protocol on the main Bitcoin network, facilitating the issuance of stablecoins and other assets while ensuring scalability and adherence to Bitcoin’s core values. This move responds to the significant demand from developers to integrate stablecoins into their applications and paves the way for the settlement of foreign exchange transactions over the Lightning network.
Cryptocurrencies Market Price Over the Past Week
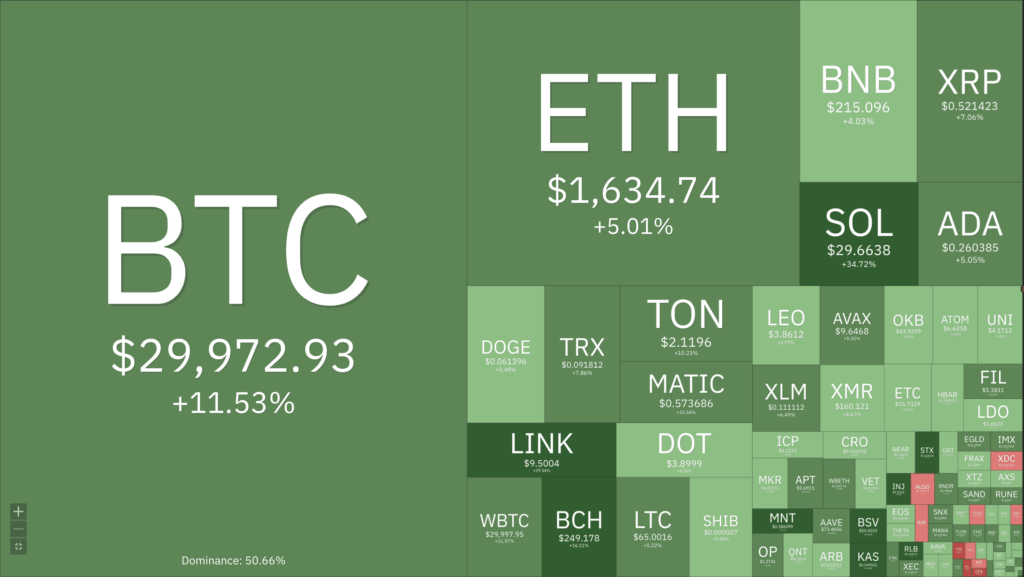
Cryptocurrencies With the Best Performance
- Chainlink +17,18%
- Aptos +9,58%
- Fantom +8,78%
- Solana 8,16%
Cryptocurrencies With the Worst Performance
- Stacks (STX) -1,01%
- Rocket Pool (RPL) -0,99%
- Maker (MKR) -0,19%
References
- The Cointelegraph Team, Clarification on sharing false spot Bitcoin ETF news, Cointelegraph, accessed on 22 October 2023.
- Polkaworld_org, Exciting times ahead for Polkadot!, X, accessed on 22 October 2023.
- Jamie Crawley, Lightning Labs Rolls Out ‘Taproot Assets,’ to Make Bitcoin ‘Multi-Asset’ Network, Coindesk, accessed on 22 October 2023.
- Scroll_ZKP, gm Scrollers, what an exciting week!, X, accessed on 22 October 2023.
Share
Table of contents
Related Article


See Assets in This Article
1.8%
0.0%
0.0%
0.0%
0.0%
BTC Price (24 Hours)
Market Capitalization
-
Global Volume (24 Hours)
-
Circulating Supply
-