Market Analysis Sept 12-18: US Inflation Increases, Crypto Market Enters Red Zone

US inflation data for August was surprisingly higher than anticipated. This could lead to a sharp increase in interest rates by the Fed at the FOMC meeting on September 21.
The higher inflation figures also put pressure on the price of crypto asset such as Bitcoin and Ethereum . In addition, the success of Ethereum in completing the merge did not succeed in driving up the price of both assets as the market already priced in.
This market analysis presents the key information that Pintu’s trading team gathered regarding the price movement of BTC, ETH, and other assets during the past week. However, kindly note that none of this information is meant as financial advice; rather, it is provided for informational and educational purposes only.
block-heading joli-heading" id="market-analysis-summary">Market Analysis Summary
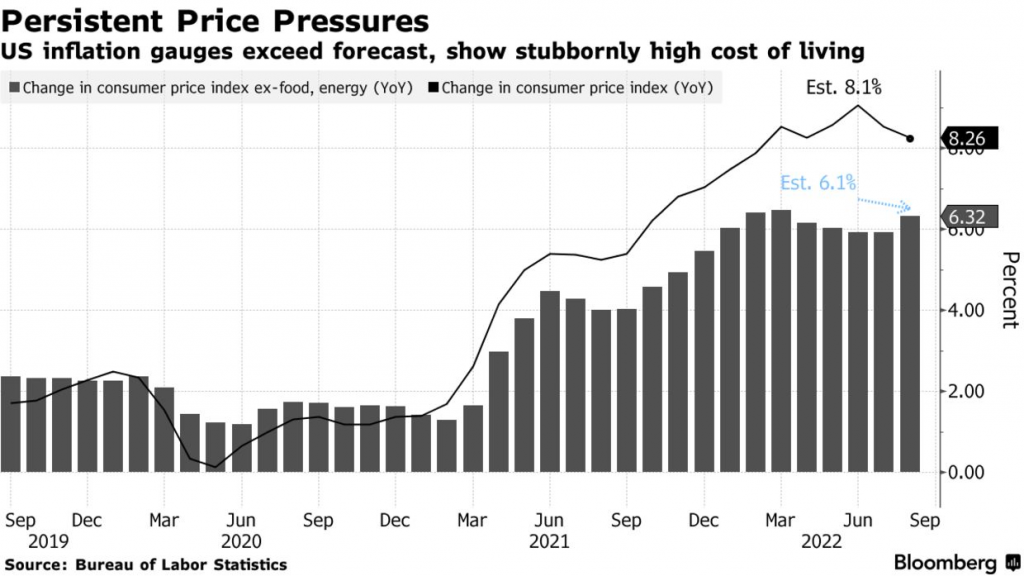
- 📈 The US Consumer Price Index (CPI) data for August came in higher than the consensus forecast. This will cause The Fed to take an aggressive stance on benchmark interest rate.
- ✅ Ethereum successfully completed ‘the merge’ this week. As expected, due to the already priced in sentiment and sell the news event, the price of ETH was plunging.
- ⚠️ Bitcoin is trading sideways and may continue to do so for the coming months until we see more structural macroeconomic improvement.
Macroeconomy Analysis
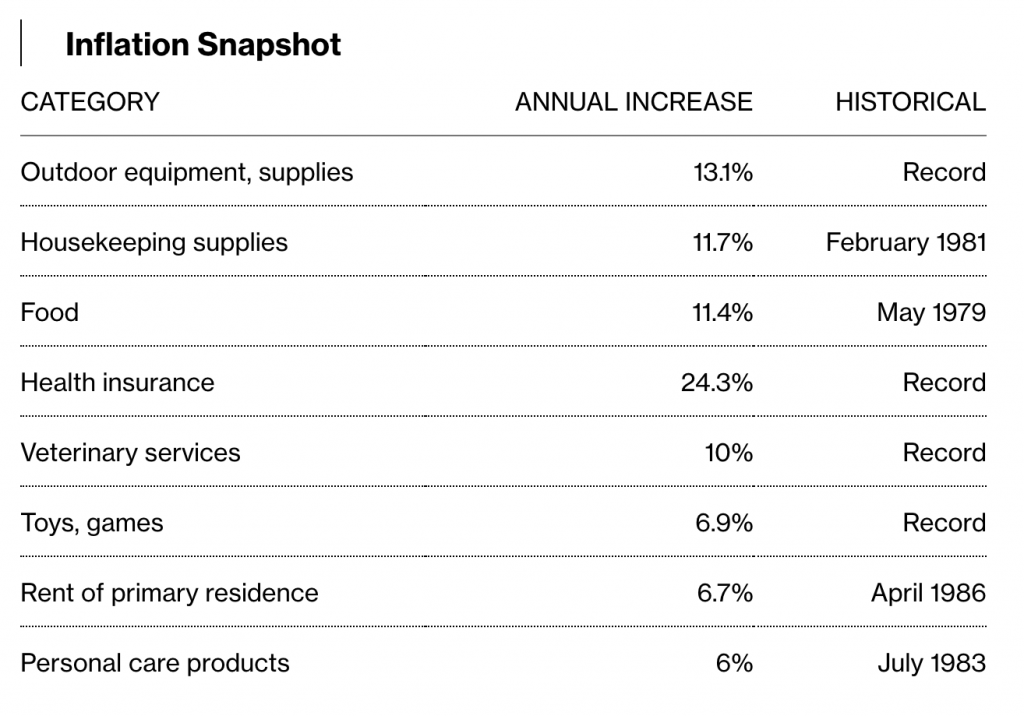
Leading indices of the US equities Dow Jones, S&P, and Nasdaq are down 3.9%, 4.3%, and 5.2%, respectively, following the release of the CPI data. CPI data was up 8.3% YoY for the month of August, higher than the consensus value of 8.1%. Core CPI was up 6.3% YoY for the month of August, higher than the consensus value of 6.1%. The largest increase contributor was in the shelter, food, and medical care indexes. These increases were mostly offset by 10.6%, decline in the gasoline index. The food index increased 11.4% YoY, the largest 12-month increase since the period ending May 1979.
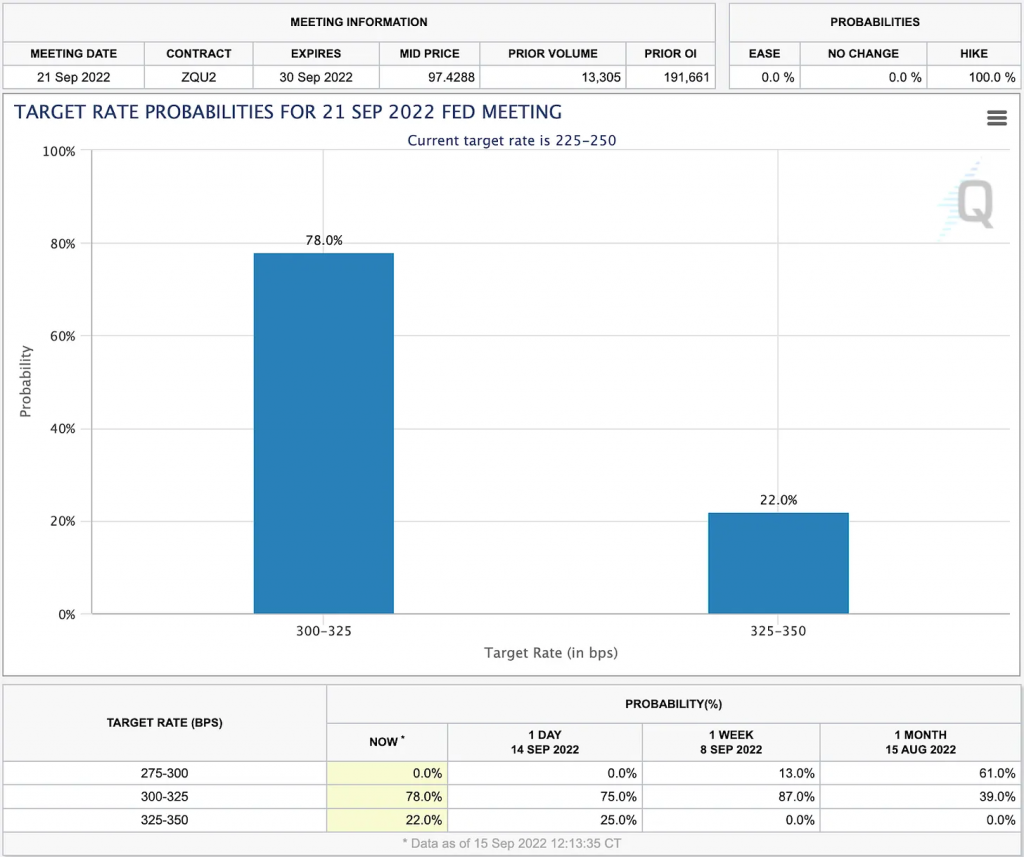
This will further increase Fed’s probability to raise the interest rates by a further 75 bps at their meeting in two weeks (21st September). In the bond market, the benchmark U.S. 10-year Treasury note held above 3.46%, while the 2-year Treasury increased further to 3.9%, the highest level since 2007. For now, we are seeing a 22% probability that a 100bps interest hike is occurring, though seems improbable, expect more market selloff when it does happen.
Ethereum Price Movement 12 – 18 September 2022
Ethereum have completed its merge, its’ new system, proof-of-stake, does away with mining entirely. Ethereum should now consume 99.9% or so less energy. The price stays stagnant upon completing the merge. However, prices of BTC and ETH both fell the day after as expected. The price of ETH has been overly priced in prior to the merge. The event is most likely a sell-the-news event as mentioned previously. Notice in the daily chart, we are about to break out of the ascending bear flag.
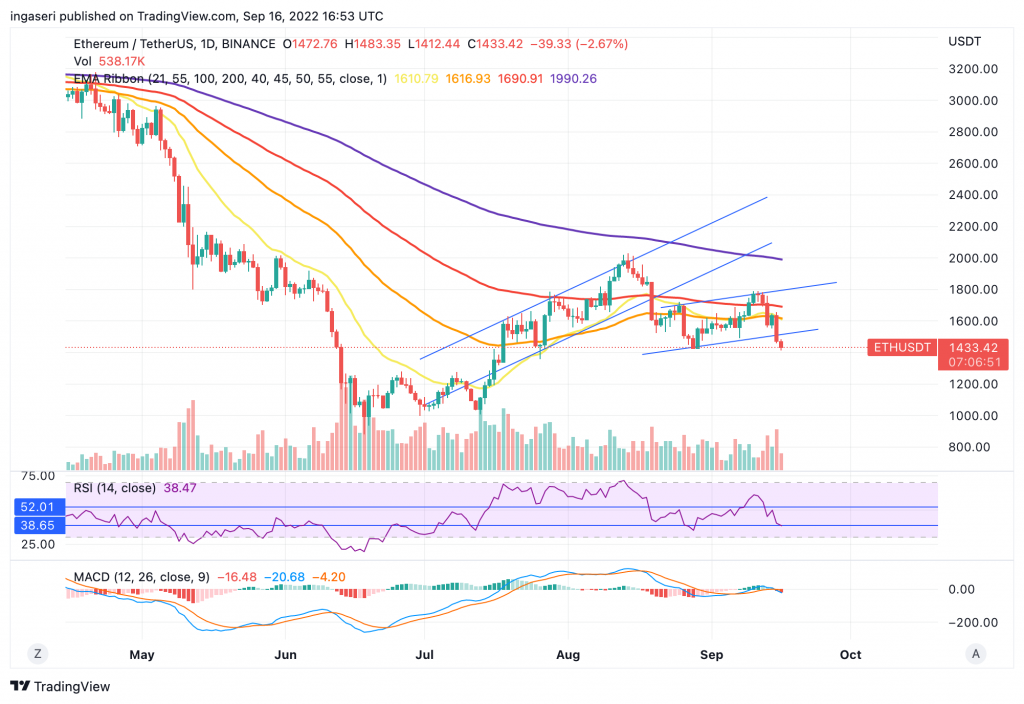
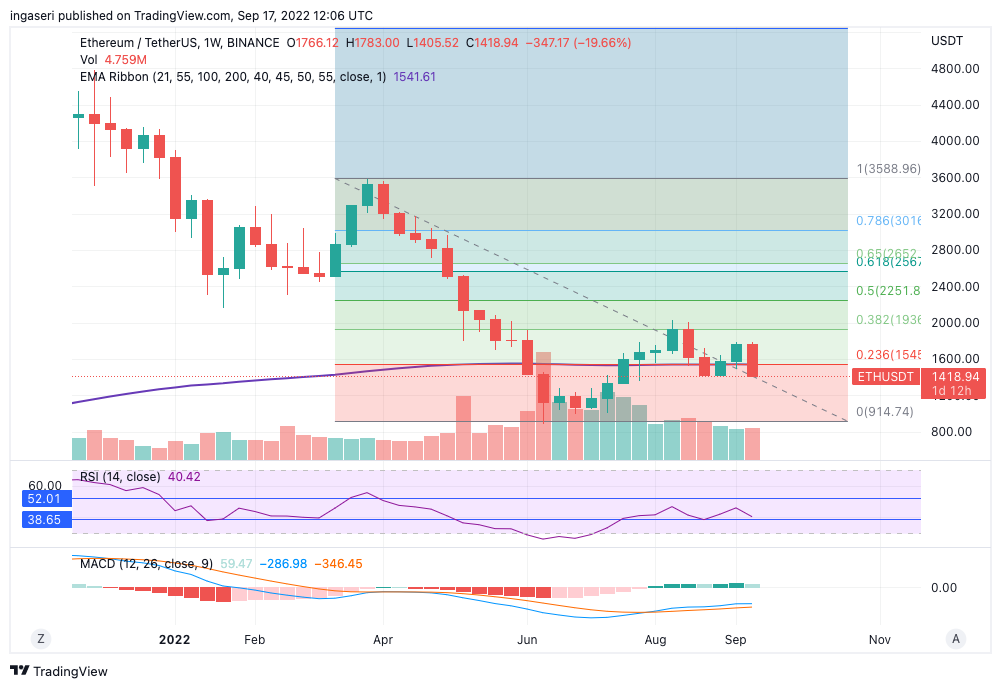
In the weekly chart, we went below the 0.236 Fibonacci support line, now at the support price line of 1425. Watch for the weekly RSI as well, as it’s nearing the support value of 38.65, historically been an important support for ETH. We can also see that the weekly candle is likely to be closing below the 200 weeks EMA once again.
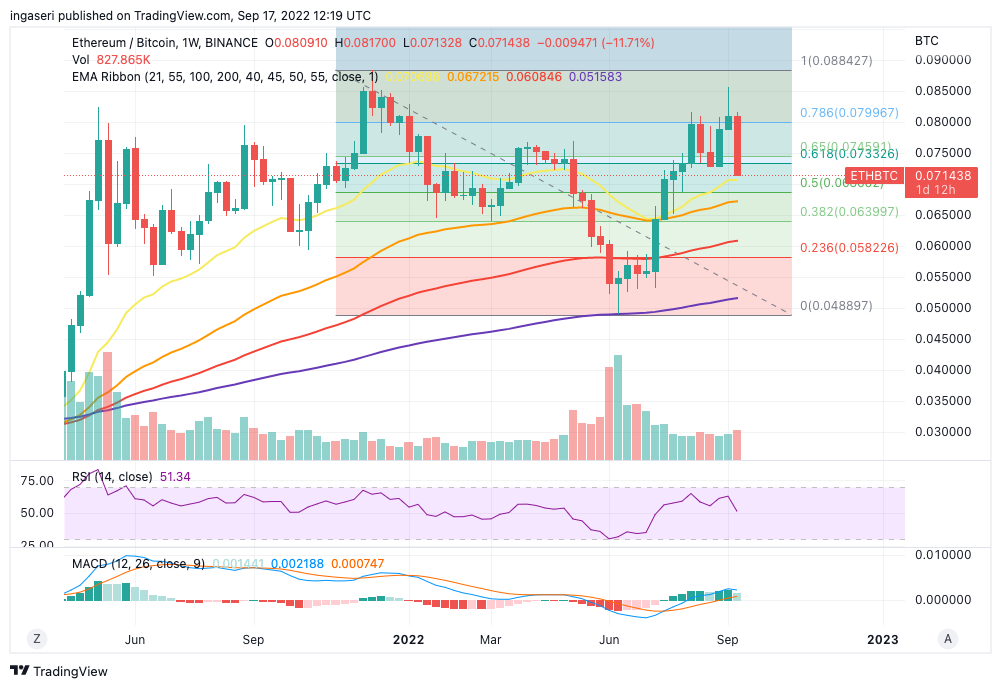
ETH/BTC has plunged over the week, with it breaking below the Fibonacci golden pocket range. In line with the sell the news merge theory, expect ETH to fall further, as it has historically done during bear markets.
Bitcoin Price Movement 12 – 18 September 2022
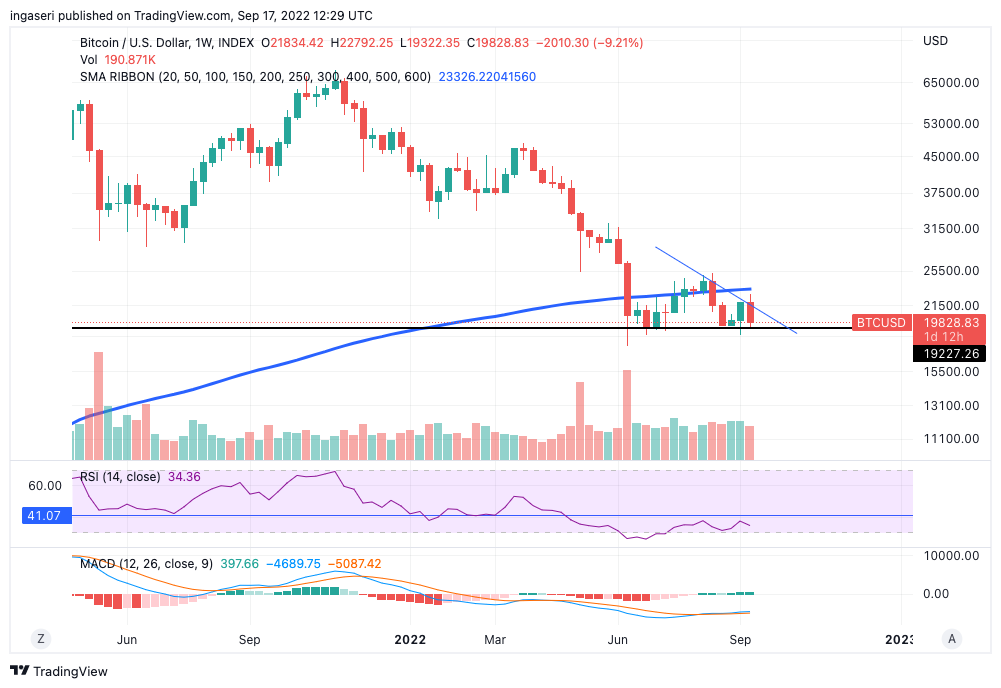
BTC still find itself with weak demand, having 200 weeks MA as resistance. I’ll be watching this line should we want to assure ourselves that the worse is over. For now, BTC is trading sideways and could possibly do so for the coming months until we see more structural improvement macro-wise. Expect more volatility as we close near the announcement of the Fed Funds rate. From its weekly chart, we can see the formation of symmetrical triangle: BTC has an equal chance of breakdown or staying at the support level of 20k. Losing this higher low level will be cause of concern, since it will once again test the 20k level. And after multiple times of testing the support level, we do not know how long of trial and strength will the 20k support level hold.
On-Chain Analysis
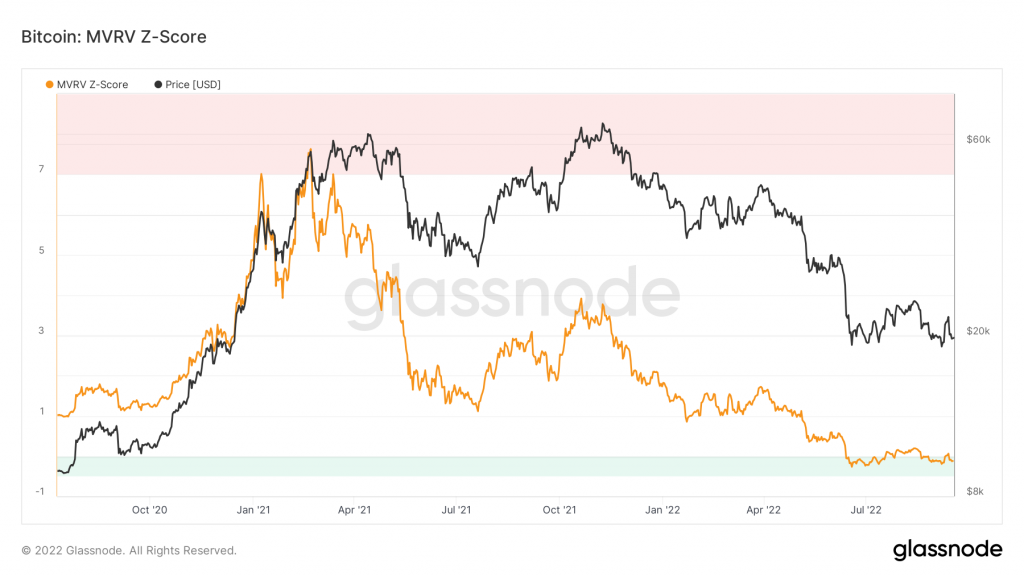
After getting out of the green zone, the MVRV-Z score is back again in the buy zone, a historically accurate indicator for bitcoin accumulation. The MVRV Z-Score is used to assess when Bitcoin is over/undervalued relative to its “fair value”. When market value is significantly higher than realized value, it has historically indicated a market top (red zone), while the opposite has indicated market bottoms (green zone). Technically, MVRV Z-Score is defined as the ratio between the difference of market cap and realized cap, and the standard deviation of all historical market cap data, i.e. (market cap – realized cap) / std(market cap).
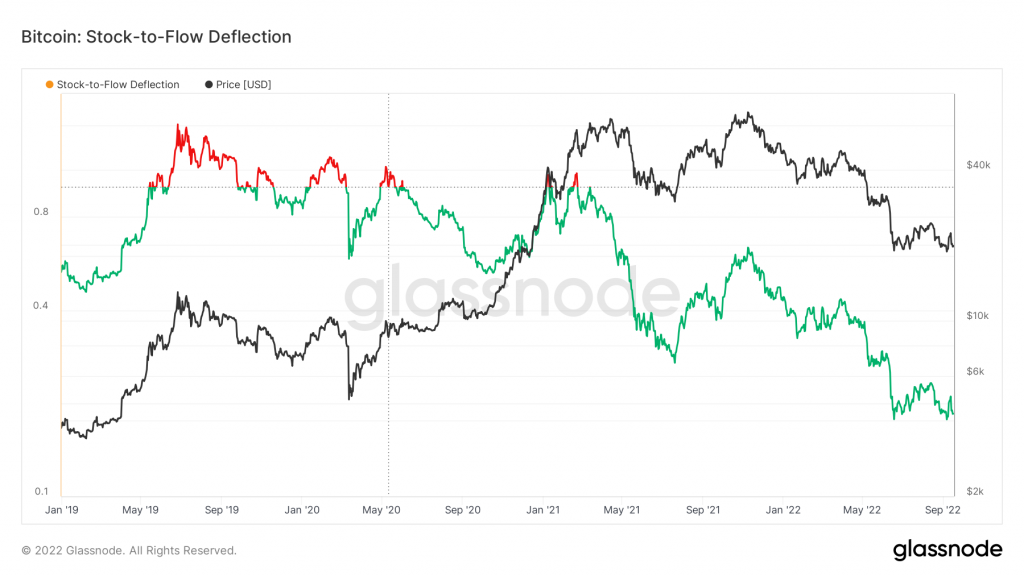
It has been a while since we take a look at the Stock-to-Flow deflection chart, which has been steadily trending down. The value represents the value between the current BTC price and the S/F model. The current value of 0.1847 is turning into a local bottom for this cycle, this historically represents a good buying opportunity.
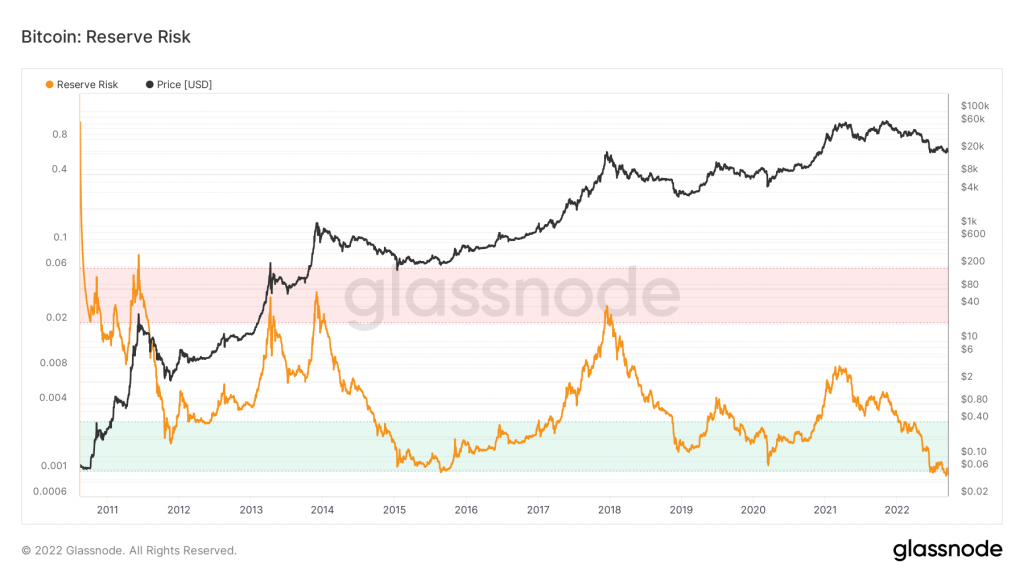
Next, let’s take a look at the reserve risk. Reserve Risk is defined as price / HODL Bank. It is used to assess the confidence of long-term holders relative to the price of the native coin at any given point in time. When confidence is high and price is low, there is an attractive risk/reward to invest (Reserve Risk is low). When confidence is low and price is high then risk/reward is unattractive at that time (Reserve Risk is high). We are currently at a historical low for this metric, which represents high attractive risk/reward to invest.
📊 Exchange: As the exchange reserve continues to fall, it indicates lower selling pressure. Net deposits on exchanges are high compared to the 7-day average. Higher deposits can be interpreted as higher selling pressure.
💻 Miners: Miners’ are selling holdings in a moderate range compared to its one-year average. Miner’s revenue is decreasing significantly compared to the cost they put in. This could indicate that price is undervalued along with the increasing miner’s motive to hold their coins.
🔗 On-Chain: More investors are selling at a loss. In the middle of a bear market, it can indicate a market bottom. Long term holders’ movement in the last 7days were lower than the average. They have a motive to hold their coins. Investors are in a capitulation phase where they are currently facing unrealized losses. It indicates the decreasing motive to realize loss which leads to a decrease in sell pressure.
🏦 Derivatives: Short position traders are dominant and are willing to pay long traders. Selling sentiment is dominant in the derivatives market. More sell orders are filled by takers. OI over the weeks have been decreasing by 12%. As OI decreases, it indicates investors are closing futures positions and possibility of trend reversals. In turn, this might trigger the possibility of long/short-squeeze caused by sudden price movement or vice versa
Altcoin News
- 🏁 On 15th September, finally Ethereum completed The Merge. After much anticipation, the Ethereum network has finally succeeded in switching from Proof of Work (PoW) to Proof of Stake (PoS). The success of The Merge is expected to make the Ethereum network consume lower energy than before. But ETH prices dropped more than 10% since the merge
- 🪙 ApeCoin Treasury set to unlock 25 millions APE tokens. Soon, ApeCoin DAO treasury expected to unlock 25 millions APE tokens, the native token for the Bored Ape Yacht Club ecosystem, allocated for “launch contributors” which the website notes are the unnamed “companies and people that helped make this project a reality.”
More News from Crypto World in the Last Week
- 🚨 South Korean court has issued an arrest warrant for Do Kwon. In the aftermath of LUNA downfall last May, Seoul Prosecutor’s Office took a firm stance by issuing an arrest warrant for Terraform Labs Cofounder, Do Kwon and five others. This decision was based the allegations that Do Kwon had violated the nation’s capital markets law.
- 🏁 GameFi fundraising jumps 135% to 748 million US dollar in August. The GameFi sector remains a leading force in the blockchain and crypto space despite the ongoing downturn in the crypto market. Recent numbers from DappRadar revealed that Web3 games and Metaverse projects raised $748 million in funds last month. This was up 135% from July but is still a decline of 16% compared with June.
- 🚘 Tesla launches new Cyberwhistle that can only be bought using Dogecoin (DOGE). Tesla launched limited-edition Cyberwhistle, a premium collectible Cybertruck-inspired whistle made from medical-grade stainless steel with a polished finish. Tesla requires buyers to pay only in Dogecoin (DOGE). The price tag at the time of publication is 1,000 DOGE or around $60.
- 🚖 Ford prepares to enter the metaverse with virtual automobile and NFT. Recently, American car manufacturer Ford Motor Company prepping its entry into the world of NFT and the Metaverse ;— filing 19 trademark applications across its major car brands. Ford plans to create downloadable artwork, text, audio and video featuring its cars, SUVs, trucks and vans, which will be authenticated by NFTs.
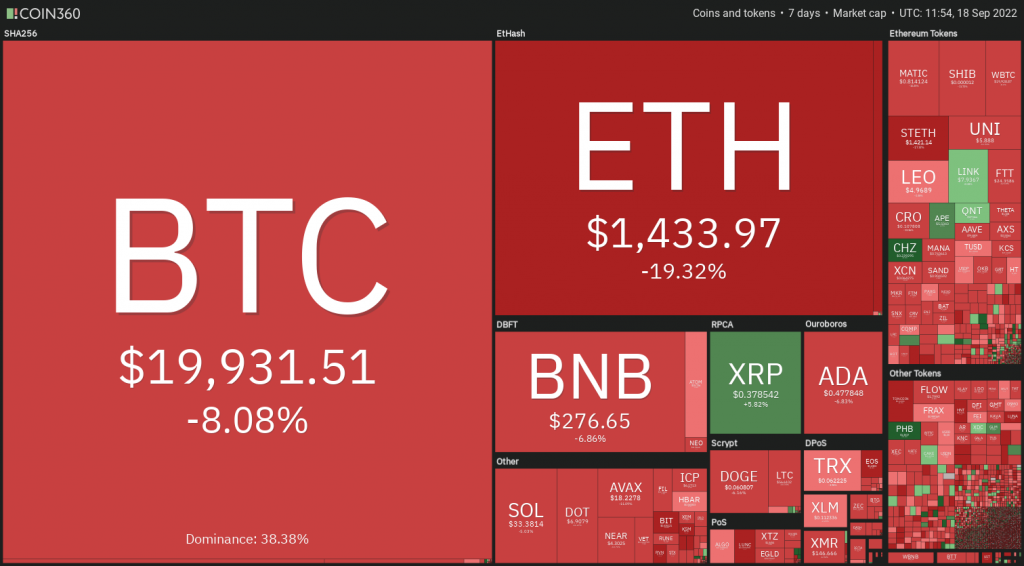
Cryptocurrencies Market Price Over the Past Week
Cryptocurrencies With the Best Performance
- Chiliz (CHZ) +12.92%
- Ape Coin (APE) +10.35%
- Quant (QNT) +5.92%
- XRP (XRP) +3.89%
- Chainlink (LINK) +1,15%
Cryptocurrencies With the Worst Performance
- Terra 2.0 (LUNA) -54.22%
- Ethereum (ETH) -17.82%
- Kusama (KSM) -15.52%
- Waves (WAVES) -13.67%
- Flow (FLOW) -13.23%
Reference
- Zhiyuan Sun, Tesla launches new Cyberwhistle that can only be bought using Dogecoin, Coin Telegraph, accessed on 16th September 2022
- Sam Kessler. The Ethereum Merge Is Done, Opening a New Era for the Second-Biggest Blockchain, Coin Desk, accessed on 17th September 2022
- Andrew Hayward, ApeCoin Treasury Set to Unlock 25 Million APE Tokens for Launch Contributors, Decrypt, accessed on 17th September 2022
- Hooyeon Kim, Terra Co-Founder Do Kwon Faces Arrest Warrant in South Korea, Bloomberg, accessed on 16th September 2022
- Juddith Bannermanquist, Ford prepares to enter the Metaverse with virtual automobiles and NFTs, Coin Telegraph, accessed on 16th September 2022.
- Ana Paul Pereira, GameFi fundraising jumps 135% in August, but is still down from June: Report, Coin Telegraph, accessed on 16th September 2022.
Share
Related Article


See Assets in This Article
BTC Price (24 Hours)
Market Capitalization
-
Global Volume (24 Hours)
-
Circulating Supply
-