Market Analysis 27 Mar-2 Apr: Bullish Bitcoin, Axie Infinity Hacked, and LUNA Skyrockets

Bitcoin (BTC) and Ethereum (ETH) price movement between 27 March – 2 April
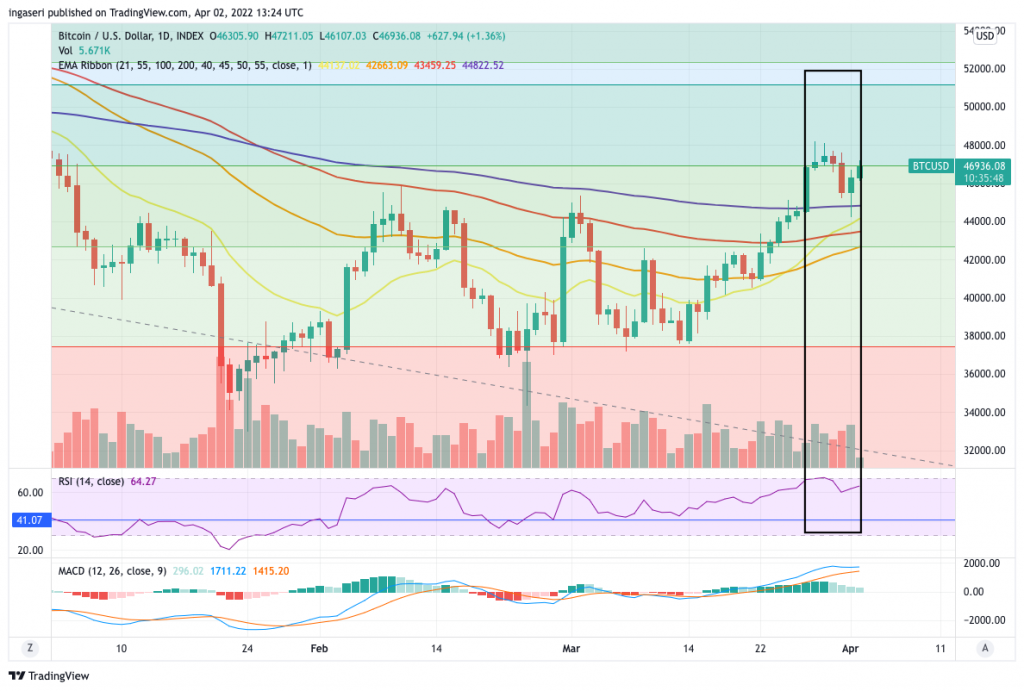
Over the past week, we’ve seen BTC rise above the 200-day EMA resistance line, where it entered the 0.5 Fibonacci zones (dark green area) and dropped back down. Currently, the resistance level is in the 0.5 Fibonacci zones. Notice how the RSI peaked on March 28 and 29 to then fell again after that.
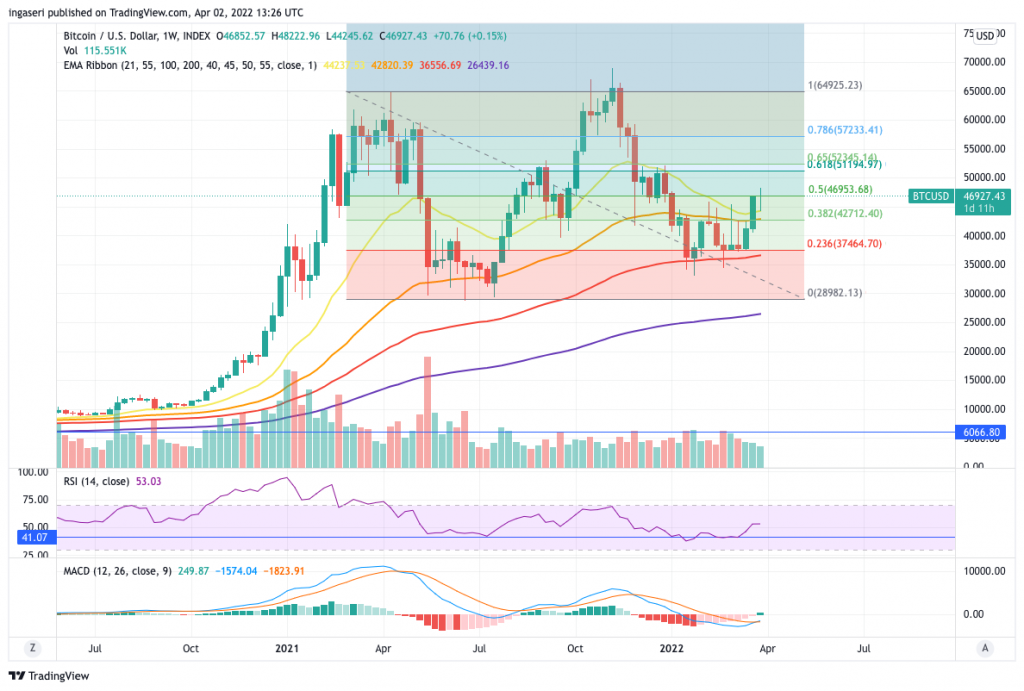
On the weekly chart, BTC managed to close above a significant support line (historically significant) which is the 21-week EMA. This price point is important because BTC must be above the 21 weeks EMA to be considered still in a bull run. In addition, we also saw how the BTC price was unable to break through the 0.5 Fibonacci zones (weekly) but returned to the 21-week EMA support. This is a good long-term support level.
Read more: 4 crypto trading indicators you should learn!
Lastly, the weekly MACD line (blue) is almost crossing the signal line (orange). When the MACD line crosses the signal line, a bullish trend confirmation occurs.
💡 What is MACD?
Moving average convergence divergence (MACD) is a technical indicator that signals the momentum of two EMAs, the 12 and 26 EMAs. MACD is a momentum indicator that can help identify trend changes.
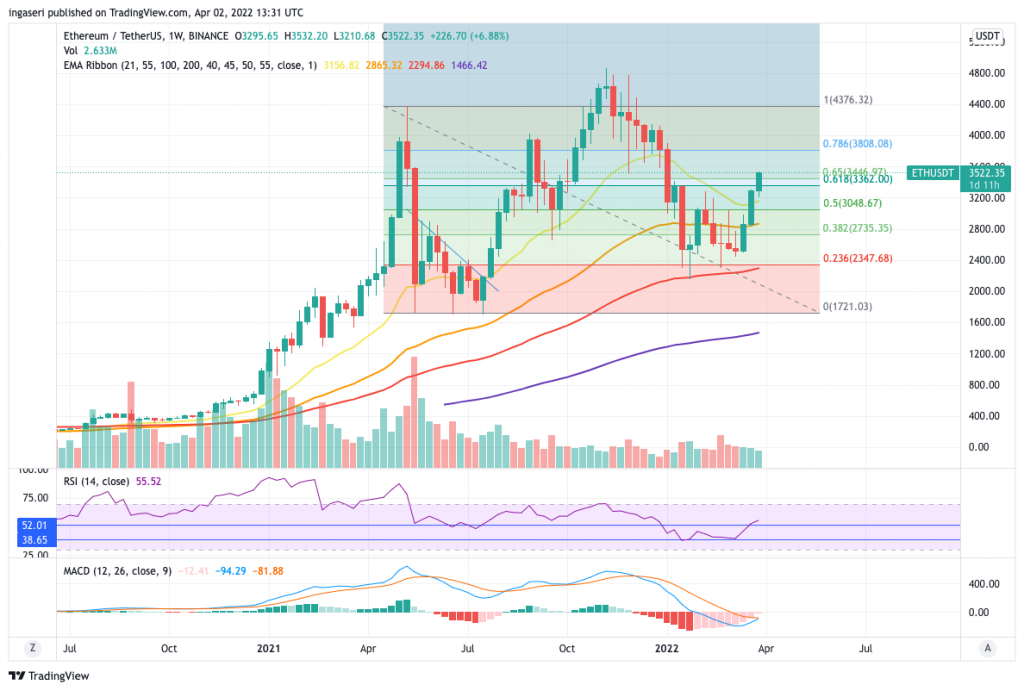
There are several interesting things about the Ethereum weekly chart above.
- ETH has just broken out of the Fibonacci golden pocket area.
- Ethereum’s RSI has just broken through the historically bullish 52 number.
- Notice that the weekly MACD line is also nearly crossing the signal line.
As the weekly chart closes, ETH should be able to break out even further.
block-heading joli-heading" id="what-else-is-there-to-observe-from-the-market-in-the-past-week">What else is there to observe from the market in the past week?
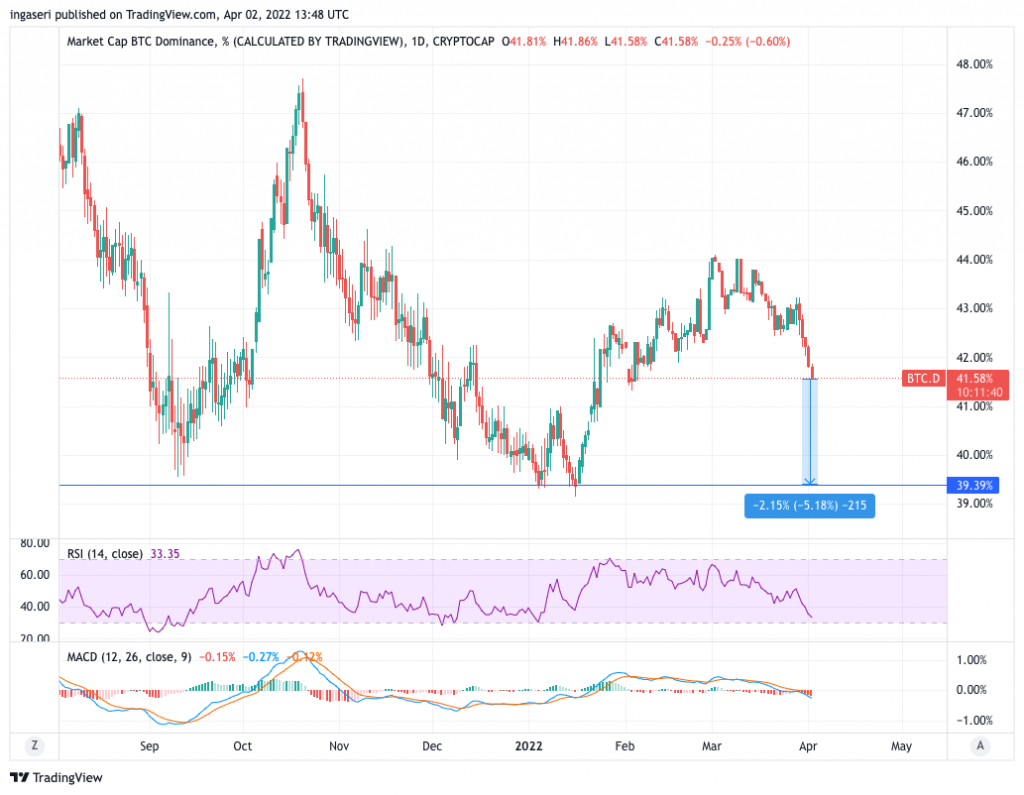
- 📉 Bitcoin Dominance decreases: BTC Dominance chart is currently at 41.5% BTC.D, historically there is a support point at 39.5%. If the bull run continues, there is a high chance that altcoins will continue to rise as the BTC.D drops further.
- 💵 Net Transfer volume continues to decline: Bitcoin continues to flow out of exchanges since last week. This pattern of outflows signals strong demand for BTC and the entire crypto market right now, a bullish sign.
- 📈 Funds into crypto: Weekly crypto inflows saw US$193 million in funds last week, the largest since mid-December 2021. Bitcoin inflows hit US$98 Million, while Solana had the largest weekly inflows in its history, for a total of US$87 Million.
Market analysis conclusion
- 🚀 Bitcoin is showing strength in its price movement where it managed to rise above the 200-day EMA resistance line. In the weekly chart, BTC managed to find a support point at the 21-week EMA line. The Bitcoin MACD line indicator also shows a potential bullish crossover.
- 🏃 Similar to Bitcoin, Ethereum also showed its strength because it managed to get out of the Fibonacci golden pocket area. Ethereum’s RSI and MACD technical indicators are also showing bullish signs which could potentially push ETH prices further up.
News from the altcoin world
- 💵 Large-scale transactions on Cardano are increasing: The number of large transaction volumes (LTV) on the Cardano network has increased rapidly since 2022. The volume of transactions with a value of over $100k dollars has increased 50x in 2022. This indicates that institutional interest in Cardano is on the rise.
- 🌕 Terra (LUNA) sets a new all-time high: LUNA, the native cryptocurrency of the Terra network, just hit a new all-time high on April 3rd at $117 dollars. LUNA took advantage of a period where BTC started to move up after stagnating for several weeks. This price increase comes after the Terra Foundation announce a week ago that it intends to buy an equivalent of $10 billion dollars in Bitcoin as Terra’s reserve currency.
Other important news from the crypto world in the last week
- ☠️ Axie Infinity hacked for $600 million dollars: Axie Infinity’s sidechain network, Ronin Bridge, was hacked on March 23 (but only discovered on March 29). A total of 173,600 WETH or Wrapped Ethereum and 25.5 million USDC have successfully been drained from the bridge connecting Ronin to the Ethereum mainnet. This hacking incident is the second time that a hack has occurred on bridge technology after the Wormhole incident last month.
- 🏦 EU Parliamentary Legislation on KYC: The EU Parliament voted on a new regulation (1 April 2022) which would essentially prohibit anonymous crypto transactions. This new legislation requires crypto service providers, such as exchanges, to collect personal information from individuals on every transaction worth over 1,000 Euros. It applies to transactions in private crypto wallets such as Meta Mask or Ledger.
- 🌗 Terra Foundation buys 2,943 BTC: The foundation behind Terra LUNA, LFG, just bought 2,943 BTC (worth $139 million) on Wednesday, March 30, 2022. This purchase is a continuation of LFG’s plan to accumulate $10 billion worth of BTC dollars as a reserve currency for UST, Terra’s decentralized stablecoin network. This reserve BTC will be stored by LFG in the worst case that UST cannot keep its peg to US dollars.
- ⚠ US Senator Elizabeth Warren encourages the creation of a CBDC: Elizabeth Warren, a senator from the democratic party, issued a statement that she wants the United States to create its own CBDC (Central Bank Digital Currency). A CBDC is basically a crypto that is controlled and regulated by the government. Elizabeth Warren herself has made several anti-crypto statements and wants the US government to regulate the crypto industry.
References
- Brian Newar, ‘Institutional demand’ — Large transactions on Cardano up 50x in 2022, Coin Telegraph, accessed on 2 April 2022.
- Yashu Gola, Terra (LUNA) hits new all-time high after 100% rebound from 2022 lows — Correction ahead?, Coin Telegraph, accessed on 2 April 2022.
- Andrew Hayward, Hacker Drains $622M From Axie Infinity’s Ronin Ethereum Sidechain, Decrypt, accessed on 3 April 2022.
- Jeff Benson dan Scott Chipolina, EU Parliament Votes to Impose KYC on Private Crypto Wallets, Decrypt, accessed on 3 April 2022.
- Joseph Hall, Terra smash-buys $139M Bitcoin, wallet reaches 31,000 BTC, Coin Telegraph, accessed on 3 April 2022.
- Greg Ahlstrand, Elizabeth Warren Calls for US to Create a CBDC, Coin Desk, accessed on 3 April 2022.
Share
Related Article


See Assets in This Article
BTC Price (24 Hours)
Market Capitalization
-
Global Volume (24 Hours)
-
Circulating Supply
-