The Complete Guide to Understanding and Using Moving Average
Moving Average (MA) is a must-know technical indicator, especially for first-time traders. This essential indicator helps you spot trends and give signals to entries or exits from the market. It also can be used to set dynamic support and resistance levels. There are three types of MAs, each with its strengths. So, what is the most used moving average? Also, how to use them? Find out more in the following article
Article Summary
- 📈 Moving Average is a technical indicator that calculates the average price of an asset over time.
- ♨️ There are three popular types of moving averages: Simple Moving Average (SMA), Exponential Moving Average (EMA), and Weighted Moving Average (WMA).
- Traders often use MAs to analyze trends, smooth out price fluctuations, and as signals to enter or exit the market.
- 💪 MAs can serve as dynamic support and resistance points, helping traders identify potential turning points in the market.
What is A Moving Average?
Moving Average (MA) is an indicator that shows the average price movement over a certain period. For example, the 20-day MA is a line that shows the average price movement over the last 20 days.
This indicator is one of the traders’ favorites as it shows the current momentum. That’s because it predicts price trend movements based on historical prices.
However, MA is a lagging indicator as it has to follow the price movement first. As a result, it is not very responsive to rapid price changes. Therefore, other technical indicators are needed to get more accurate results.
What is a lagging indicator? What is the difference between leading indicators? Find the explanation here.
Types of Moving Average
MA is an indicator that focuses on the average price over a certain period. As a result, it has various types. Simple Moving Average, Exponential Moving Average, and Weighted Moving Average are the most commonly used MA indicators by traders.
Simple Moving Average (SMA)
The most basic and popular MA indicator is Simple Moving Average (SMA). As the name implies, the calculation is very simple. The sum of all recent data points is divided by the number of data points in a given period.
In SMA, the historical data used includes the highest, lowest, opening, and closing prices. It is commonly used to identify trends as well as find the most ideal moments to enter or exit the market.
Simple Moving Average Formula
The formula used to calculate SMA is quite simple. For example, the price of crypto A in the last 10 days is 500, 450, 400, 470, 530, 560, 640, 700, 850, and 900.
Based on this data, to find the SMA value in 10 days, the calculation is as follows:
- SMA 10 = (500+450+400+470+530+560+640+700+850+900)/10 = 600
Exponential Moving Average (EMA)
Compared to the SMA, the Exponential Moving Average (EMA) has better accuracy. This is because the EMA gives higher weight to more recent prices. Whereas the SMA gives equal weight to all prices. In other words, the EMA is more sensitive to recent price movements than the SMA.
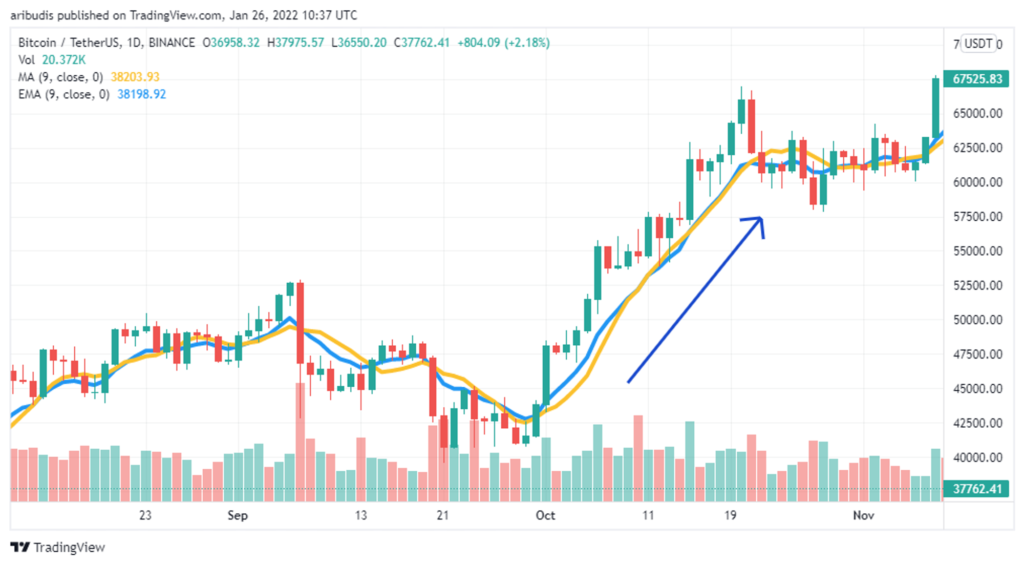
Traders can also identify price trends using the EMA. If the asset’s price chart is below the EMA line, it indicates a downward or bearish trend. On the contrary, if the price chart is above the EMA line, it indicates an upward or bullish trend.
Generally, traders divide the EMA line into several periods, such as the 20-day, 50-day, and 100-day EMA. This distinction is used to spot short-term trend movements. It also determines support and resistance levels.
Exponential Moving Average Formula
In calculating EMA, two calculations must be done first. First, traders calculate the SMA at a certain period. Second, since EMA uses weighting, a multiplier is required. The formula for the multiplier is [2/(MA+1 period).
For example, after calculation, the 20-day SMA of crypto B’s price is IDR 1,123. Meanwhile, the multiplier factor is [2/(20+1)], which is 0.09.
If the crypto B price on the 21st day is Rp 1,215, then the calculation for the 20-day EMA is as follows:
- EMA 20 = 1.123+0,09(1.215- 1.123)= 1.131,28.
Find out about other crucial indicators used for technical analysis in the following article.
Weighted Moving Average (WMA)
The Weighted Moving Average (WMA) is an enhanced version of the SMA. It adds distributed weights to its calculations. In WMA, the most recent data points are weighted more heavily as they are considered to have higher relevance than older data. This aims to provide higher calculation accuracy.
The difference between WMA and EMA is in the level of weighting on the most recent data. In WMA, the decrease in weighting is more consistent. The overall amount of weighting used in WMA must add up to 1 or 100%.
While in EMA, the weighting decrease rate can be different from each other or exponential. It is different from the SMA where the weights are divided equally.
Weighted Moving Average Formula
The formula to calculate the weighted average is:

To make things easier, here is an example of the calculation for WMA. The closing prices of crypto C in the last five days (January 1-5) were IDR 70,500, IDR 71,800, IDR 69,900, IDR 73,000, and IDR 73,200. As there are five crypto price data and the overall weighting amount must be 1 or 100%, the dividing number used is 15.
As mentioned earlier, the level of weighting on the most recent price is most significant. After assigning weights to each price, traders just need to multiply the price by its weight to get the WMA. Here are the results:
| Date | Crypto Prices | Weighting | Weighted Average |
|---|---|---|---|
| 1 January | IDR 70.500 | 1/15 | IDR 4.700 |
| 2 January | IDR 71.800 | 2/15 | IDR 9.573 |
| 3 January | IDR 69.900 | 3/15 | IDR 13.980 |
| 4 January | IDR 73.000 | 4/15 | IDR 19.467 |
| 5 January | IDR 73.200 | 5/15 | IDR 24.400 |
After that, add up all the weighted average values, the WMA 5-day for crypto C is as follows:
- WMA 5-day: 4.700+9.573+13.980+19.467+19.467+24.400= Rp 72.120
Uses of Moving Averages
- 🔍 Identifying Market Trends. The main use of moving averages is to identify market trends. If the price is above the MA, it is an uptrend. Meanwhile, if the price is below the MA, it is a downtrend. Then, if the price is around the MA, it indicates a sideways trend.
- 🌊 Smoothing Data Fluctuations. The use of MA can also be used to smooth and eliminate noise in crypto movements. As a result, the trend can become clearer, making it easier to identify patterns or key levels.
- 💡 Providing Signals. Another function of MA is to provide signals related to asset price movements. With MA, traders can identify potential signals to enter or exit the market.
The Use of Moving Averages in Trading
The two most popular and often-used SMA patterns are the death cross and the golden cross. A death cross occurs when the 50-day SMA is below the 200-day SMA. The appearance of a death cross shows a bearish signal. Meanwhile, a golden cross is formed when the short-term SMA is above the long-term SMA. If followed with high trading volume, it indicates a bullish signal.
MAs can also serve as dynamic support or resistance points. Unlike the horizontal support and resistance lines, it is dynamic as it constantly shifts with the latest price movements.
If the price chart is above the MA line, then the MA line becomes the support level. Meanwhile, if the price chart is below the MA line, the MA line becomes the resistance level. For example, have a look at the BTC/USD price chart below. The price chart uses weekly candles and the blue line is the 20 EMA.
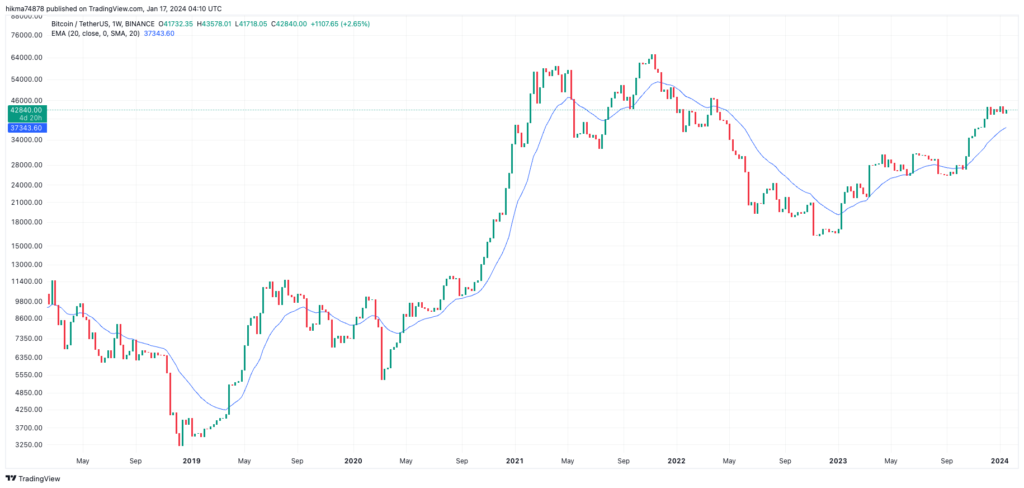
It can be seen that BTC prices made the 20 EMA line (blue line) as support several times. The 20 EMA line managed to become support. It was not broken and the price rebounded and continued to rise. Likewise, when the price tries to rise, the EMA line becomes a resistance. Keep in mind that sometimes the price will not rebound perfectly from the EMA. Sometimes it will cross the line first before finally returning to the previous trend.
However, just like with support and resistance, these levels can be exceeded. The chart above shows that when the price drops and breaks the EMA 20 line (support), it then undergoes a further correction. Thus the support point turns into resistance. However, when the price increases and breaks the EMA 20 line, the price continues its uptrend. As a result, the resistance level turns into a support level
You can use TradingView to perform technical analysis with MA and other indicators. Let’s learn how to use it here.
Conclusion
Moving Average (MA) is a technical indicator that shows the average price of an asset over a certain period. There are three main types of MAs. First, Simple Moving Average (SMA), is the simple and popular one. Second, the Exponential Moving Average (EMA), the more sensitive to recent prices. Third, Weighted Moving Average (WMA), is the one with higher accuracy as it gives more weight to recent data
MAs are often used in trading to identify market trends, smooth out price fluctuations, and provide entry or exit signals. In addition, they can act as dynamic support or resistance. However, just like any other technical indicator, MA cannot stand alone and may produce false signals. Therefore, be sure to combine it with other technical indicators for more accurate results.
Buy Crypto Assets on Pintu
After knowing the types of moving averages, don’t forget to use them before buying crypto assets on Pintu. You can safely and conveniently purchase a wide range of cryptocurrencies such as BTC, ETH, SOL, and others safely and easily at Pintu. Pintu diligently evaluates all its crypto assets, highlighting the significance of being cautious.
Pintu is also compatible with popular wallets such as Metamask to facilitate your transactions. Download Pintu app on Play Store and App Store! Your security is guaranteed because Pintu is regulated and supervised by Bappebti and Kominfo.
Aside from buying and trading crypto assets, you can expand your knowledge about cryptocurrencies through various Pintu Academy articles. Updated weekly, all Pintu Academy articles are made for knowledge and educational purposes, not as financial advice.
References
- Adam Hayes, Simple Moving Average (SMA): What It Is and the Formula, Investopedia, accessed on 15 January 2023.
- James Chen, What is EMA? How to Use Exponential Moving Average With Formula, Investopedia, accessed on 15 January 2023
- Charles Potters, How to Trade with Weighted Moving Average, Capital, accessed on 15 January 2023.
- Baby Pips, How to Use Moving Averages as Dynamic Support and Resistance Levels, accessed on 15 January 2023.
Share