The Difference Between Lagging and Leading Indicators

Traders often use lagging and leading indicators when conducting technical analysis. They are indicators that provide time-based information in response to price movements. Understanding lagging and leading indicators can help investors better interpret what is happening in the market. So what are lagging and leading indicators? What are the differences between them? Find out in this article.
block-heading joli-heading" id="article-summary">Article Summary
- 🔭 Leading indicators is indicators that use price data to predict the future of price or trend movement.
- 🔎 Lagging indicators are indicators based on historical data that are used to confirm the current price or trend.
- ⭐ Fibonacci retracement, on balance volume, and relative strength index are considered as leading indicators. Meanwhile. moving averages and bollinger bands are lagging indicators.
- ⚖️ By understanding leading and lagging indicators, traders can identify possible price movements of an asset. This can make it easier for traders to develop the most optimal trading strategy.
What is Leading Indicator?
Leading indicators is indicators that use price data to predict the future of price or trend movement. Leading indicators can help traders identify trends early, providing trade entry and exit points. Traders often use leading indicators to help them develop a trading strategy.
Price actions are often used as a comparison for leading indicators. If an asset’s price falls and the indicator starts rising before the price does, it is considered a leading indicator. This is because the indicator forecasts the asset’s price movement.
Keep in mind, leading indicators cannot guarantee 100% that the price will follow the indicator because they can give false signals. That is, the price moves opposite to the projection of the indicator. Therefore, traders should not entirely rely on leading indicators but use them only as a guide.
What is Lagging Indicator?
Lagging indicators are indicators based on historical data that are used to confirm the current price or trend. It focuses on previous price movements to provide information on what is happening in the market.
Regarding movement, lagging indicators tend to lag behind the action. As a result, the information and signals presented to traders are past movements and do not indicate what will happen in the next move.
Even so, lagging indicators are still helpful for traders because they simplify an asset’s price action while showing the trend. This can give traders an insight into where the price might go next. In addition, some lagging indicators can still indicate where the price will go.
In the following article, you can learn more about how to do technical analysis.
Leading Indicator Examples
Here are some leading indicator examples:
Fibonacci Retracements
Fibonacci retracements are considered a leading indicator because they attempt to predict where prices will go next. This can be done by drawing lines to determine an asset’s possible support and resistance levels. Using fibonacci, traders can determine entry and exit points, and stop-loss areas.
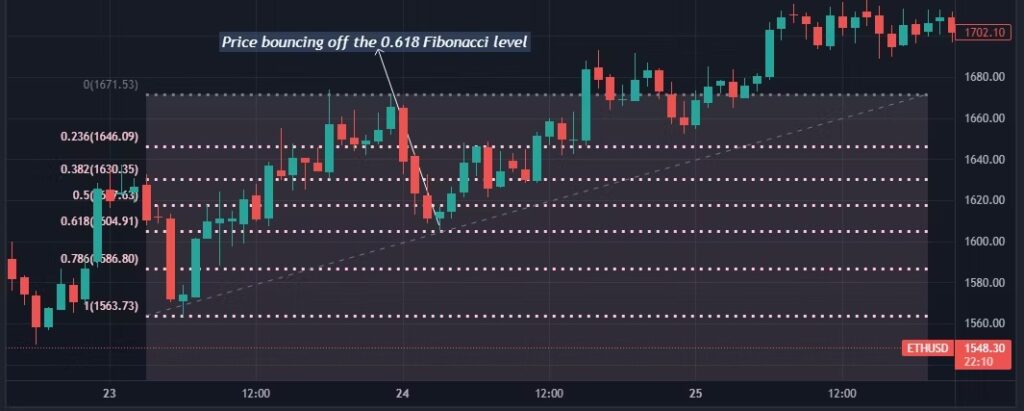
If the price of an asset starts to go down or trend upwards, traders using the fibonacci retracements tool can draw a line to connect the last relevant swing high and swing low. These lines would help traders see the invisible support levels in the market. It will make determining where the price may reverse or continue easier.
On Balance Volume
Another leading indicator is On Balance Volume (OBV), which shows the decrease and increase in total transaction volume. Using OBV, traders can see where the price will go as transaction volume and price are closely linked.
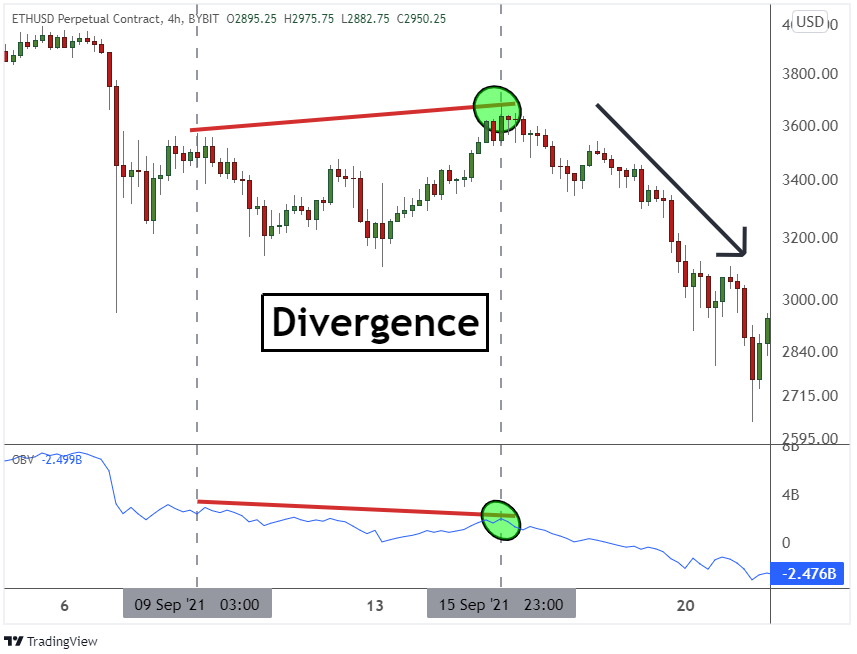
When an uptrend is followed by a high volume of transactions, it indicates that the price is still going up. However, if the price movement and the volume of transactions contradict each other, it shows a possible change in trend. OBV will make it easier for traders to determine their next move.
Relative Strength Index
The Relative Strength Index (RSI) is a leading indicator because it can indicate a change in the market momentum before it reflects in the price movements. For example, an RSI divergence suggests that the current trend has lost momentum and could experience a trend reversal. Traders can see this as a signal that prices will fall.
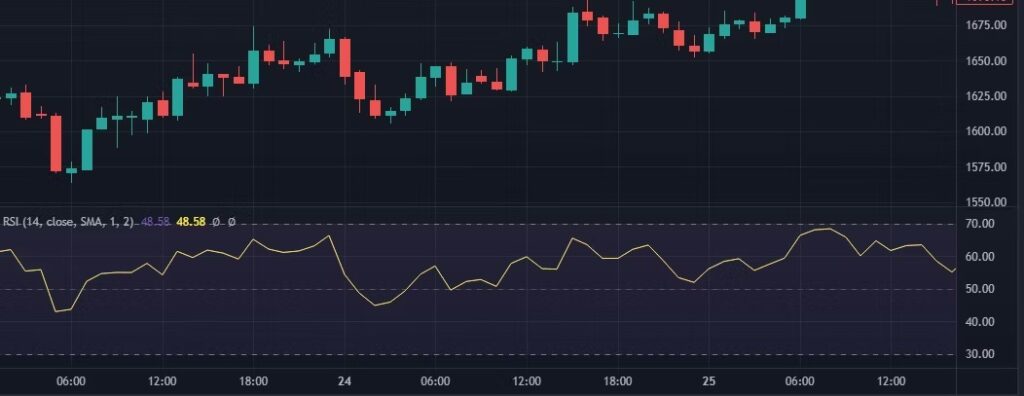
But on the other hand, the RSI can also function as a lagging indicator. This is because the price has to move first for the RSI indicator to move in the same direction. Basically, the RSI moves simultaneously with the price, with only a slight delay.
Curious to know how to read candlestick patterns? Find out in the following article.
Lagging Indicator Examples
Here are some lagging indicator examples:
Moving Average
Moving averages are categorized as lagging indicators because they use average historical price movements. It can be used to identify the trend and price direction. For example, when the price declines and reverses, the moving averages could rise higher than the price does.
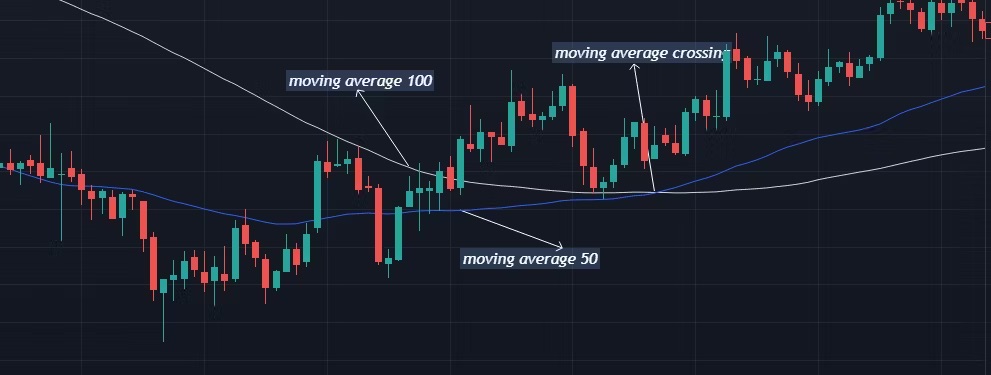
Moving averages can also be a leading indicator, as MA movements can signify where the prices will find their support or resistance points. This is because prices often experience mean reversion, where the prices return to their normal or average area after pulling away from the average.
Bollinger Bands
Another lagging indicator is the bollinger band, an indicator based on the level of volatility. It uses moving averages that act as upper, middle, or lower bands to identify whether prices are relatively higher or lower. What makes bollinger bands a lagging indicator is that it reacts only after price action.
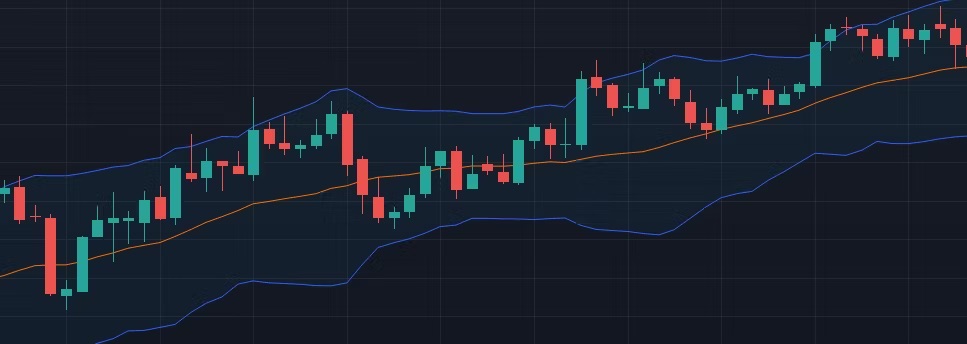
Apart from being a lagging indicator, bollinger bands can also be called a leading indicator. The idea is that price movements that pass through the outer bands will eventually return to the moving average area. Therefore, the outer bands can be seen as support and resistance levels.
Learn more about the moving average and bollinger band indicators in the following article.
The Difference between Leading dan Lagging Indicators
The difference between leading and lagging indicators is the signal that each type of indicator shows. The signals shown in leading indicators are predictions of price actions or trends. While in lagging indicators, the signals displayed have already occurred, so they are used to confirm price actions or trends.
The difference between leading and lagging indicators is insignificant. Leading indicators are not better than lagging indicators, and vice versa. For traders, what matters is how they use each indicator and interpret it. Both leading and lagging indicators have their uses in informing about price movements.
Conclusion
The choice of using either leading or lagging indicators as tools in trading depends on the strategy being used. Some traders may favor leading indicators. Others may prefer lagging indicators or a combination of both. Moreover, depending on their interpretation, some indicators may be classified as leading or lagging.
By understanding how to read each indicator, traders can better identify asset movements. This also makes it easier for traders to develop trading strategies. However, it is essential to remember that these indicators are merely tools that can sometimes produce false signals.
Therefore, it is also important to prepare for risk mitigation when signals are unreliable. Traders may choose to implement stop-loss orders or position sizing. So when trading does not go as expected, the losses experienced will not be significant.
Leading and lagging indicators can also be used in scalping. Find out the explanation of scalping in the following article.
Buy Crypto Assets in Pintu
Interested in investing in crypto assets? Take it easy, you can buy various crypto assets such as BTC, ETH, SOL, and others safely and easily. Furthermore, Pintu has subjected all its crypto assets to a thorough evaluation process, emphasizing the importance of prudence.
Pintu is also compatible with popular wallets such as Metamask to facilitate your transactions. Download Pintu app on Play Store and App Store! Your security is guaranteed because Pintu is regulated and supervised by Bappebti and Kominfo.
In addition to executing transactions, in the Pintu Apps, you can also learn more about crypto through various Pintu Academy articles updated weekly! All Pintu Academy articles are made for knowledge and educational purposes, not as financial advice.
Reference
CMC Market, Leading and Lagging Indicators, accessed on 15 March 2023.
Learn Crypto, How to Trade Crypto: Leading & Lagging Indicators, accessed on 15 March 2023.
Temitope Olatunji, What Are Leading and Lagging Indicators in Crypto Trading? Make Use Of, accessed on 15 March 2023.
Investopedia Team, 7 Technical Indicators to Build a Trading Toolkit, Investopedia, accessed on 15 March 2023.
Share