What is iShares Core MSCI EAFE Ondo Tokenized ETF (IEFAon)?
The iShares Core MSCI EAFE ETF is one of BlackRock’s popular ETFs that offers exposure to global stock markets outside the United States and Canada. Managed by BlackRock Fund Advisors, this ETF invests in stocks of companies from various sectors, covering both growth and value investment styles as well as a variety of market capitalization sizes. With the aim of following the performance of the MSCI EAFE IMI Index through a representative sampling method, this ETF, which was established in 2012 and domiciled in the United States, is often the choice of investors who want to diversify internationally in a practical way.
Article Summary:
⏳ iShares Core MSCI EAFE ETF (IEFA) was launched on October 18, 2012.
➡️ EAFE stands for Europe, Australasia, and Far East.
⛓️ IEFAon is a tokenized version of the iShares Core MSCI EAFE ETF issued by Ondo.
📈 IEFA’s market capitalization was recorded at approximately $177.79 billion as of February 20, 2026.
What is IEFA?
iShares Core MSCI EAFE ETF (ticker: IEFA) is a globalexchange-traded fund (ETF) that tracks the performance of developed stock markets outside the United States and Canada. The product provides exposure to approximately 2,614 stocks, with the largest sector composition in financial services (23%), followed by industrials (19%), and consumer cyclicals (10%).
Simply put, IEFA ETF is an investment vehicle that “wraps” many stocks in one product, so investors can directly diversify into large, mid, and small cap companies without having to buy stocks individually.
Launched on October 18, 2012, the iShares Core MSCI EAFE ETF (IEFA) has grown into a giant ETF with approximately $178 billion in assets under management (AUM) and offers a very low annual expense ratio of 0.07%. For those of you asking “What does EAFE stand for?”, EAFE stands for Europe, Australasia, and Far East. This means that IEFA’s investment coverage includes Europe, Australasia (Australia and New Zealand), and the Far East such as Japan, Hong Kong, and Singapore.
Strategically, IEFA is a passive index ETF that aims to track the MSCI EAFE IMI Index. The index covers large-, mid- and small-capitalization stocks from developed markets around the world and covers about 99% of the free-float market cap in each country.
According to the American Association of Individual Investors (AAII) report, the ETF is managed by a four-member management team with an average tenure of around 3.96 years: Jennifer Hsui (since 2012), Peter Sietsema (since 2025), Matt Waldron (since 2025), and Steven White (since 2025). It’s worth noting that the length of experience of the management team is usually more crucial in actively managed ETFs, whereas in passive ETFs like this one, the role tends to be more limited as the main focus is to follow the index.
Some of its largest holdings include ASML Holding N.V., Roche Holding AG, and HSBC Holdings Plc. Despite having thousands of stocks in its portfolio, its composition remains well diversified-the 10 largest stocks only account for about 11.4% of total assets.
With a track record of about 13 years, IEFA’s investments focus heavily on companies in Europe and Asia. The ETF also meets the requirements of the US capital markets regulator (SEC) as a diversified fund and does not specifically apply ESG-based strategies in its investment selection.
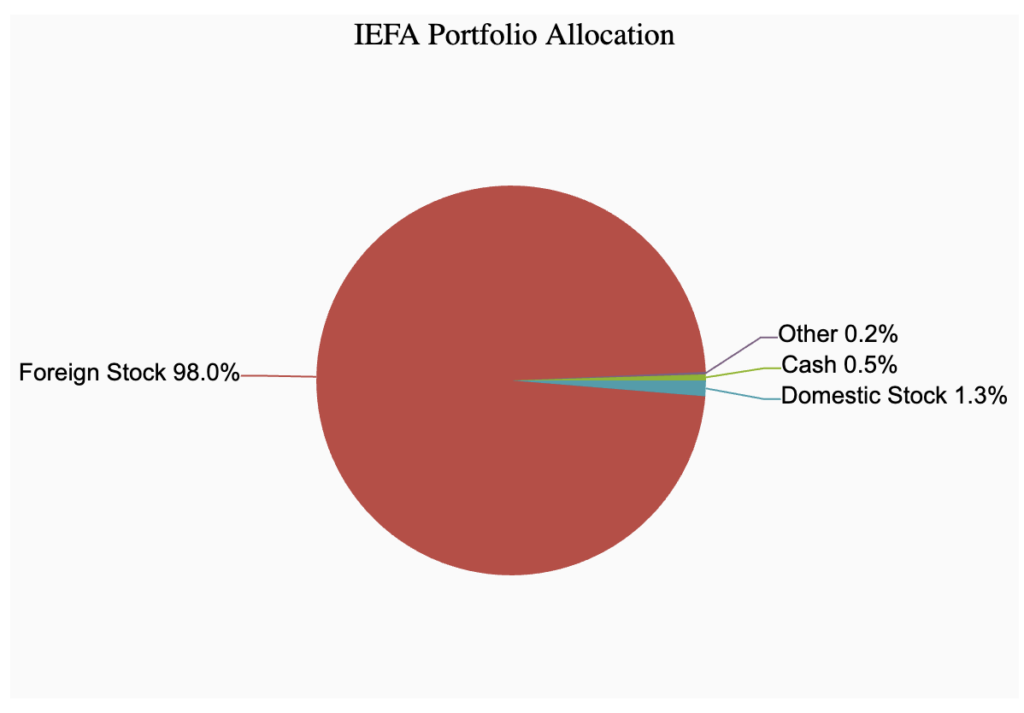
Categorically, iShares Core MSCI EAFE ETF belongs to the global stock asset class (Equity) and is in the International Equity ETF group. About 98.0% of the iShares Core MSCI EAFE ETF portfolio is allocated to foreign stocks, while about 1.3% is placed in domestic stocks. There is no allocation to preferred stocks or bonds – domestic, foreign, or convertible bonds. In addition, about 0.5% of iShares Core MSCI EAFE ETF’s assets are held in cash.
What is IEFAon?
IEFAon is a tokenized version of the iShares Core MSCI EAFE ETF (IEFA) issued by Ondo. By holding IEFAon, token holders gain economic exposure similar to holding IEFA directly, including the effects of dividend reinvestment.
Through Ondo’s tokenized stock and ETF services, retail and institutional users outside the United States can mint and redeem tokens representing US stocks and ETFs quickly, 24 hours a day and 5 days a week.
Tokenized Stock IEFA How it Works and Risks
IEFAon is a tokenized stock, a digital token on the blockchain that is backed by real assets and represents ownership of the traditional securities on which it is based. Ondo Finance’s infrastructure takes care of both compliance and the technical bridging process between the blockchain world and conventional financial markets, so each token is fully backed.
Regulatory and compliance risk as the product sits at the intersection of two ecosystems, capital markets and crypto assets. If there is a change in the rules on either side, it may impact investor access as well as the level of liquidity of the tokens in the market.
Difference between IEFA and IEFAon
Here are some differences between IEFA and IEFAon:
| Aspects | IEFA (iShares Core MSCI EAFE ETF) | IEFAon (Ondo Tokenized IEFA) |
|---|---|---|
| Product form | Traditional ETFs (capital market securities) | Tokenized stock (tokens on the blockchain) |
| Publisher/Platform | iShares/BlackRock | Ondo Finance (Ondo Global Markets) |
| What investors hold | IEFA ETF Units | Token representing exposure to IEFA (fully backed as per Ondo structure) |
| Place of transaction | Stock exchange (through securities brokers) | On-chain (token transfer) + mint/redeem process via Ondo (with conditions) |
| Access hours | Following exchange hours | Ondo calls mint & redeem 24 hours, 5 days a week (no restrictions) |
| The “creation/redemption” mechanism | ETF structure via authorized participants; retailers usually buy/sell on exchanges | Mint (print tokens) & redeem via Ondo + compliance infrastructure |
| Dividends | Shared as ETF distribution/dividend | Ondo description: economic exposure similar to holding IEFA and dividend reinvestment |
| Target users | Investors who can access ETFs on exchanges (depending on country/broker) | Aimed at non-US retail & institutions; eligibility/jurisdiction requirements apply. |
| Liquidity | Exchange liquidity & ETF ecosystem | Rely on traditional liquidity + Ondo mechanism; on-chain liquidity depends on token markets |
| Key risks | Market risk, exchange rate, tracking error, etc. | Market risk + additional: technology/smartcontract, operational/custodial, counterparty risk, as well as regulatory risk & access/transfer restrictions |
| Regulation & compliance | Capital market framework (SEC, etc.) | Compliance handled by Ondo; rules may vary between jurisdictions and are subject to change. |
10 Years of IEFA Performance
IEFA Market Cap Growth
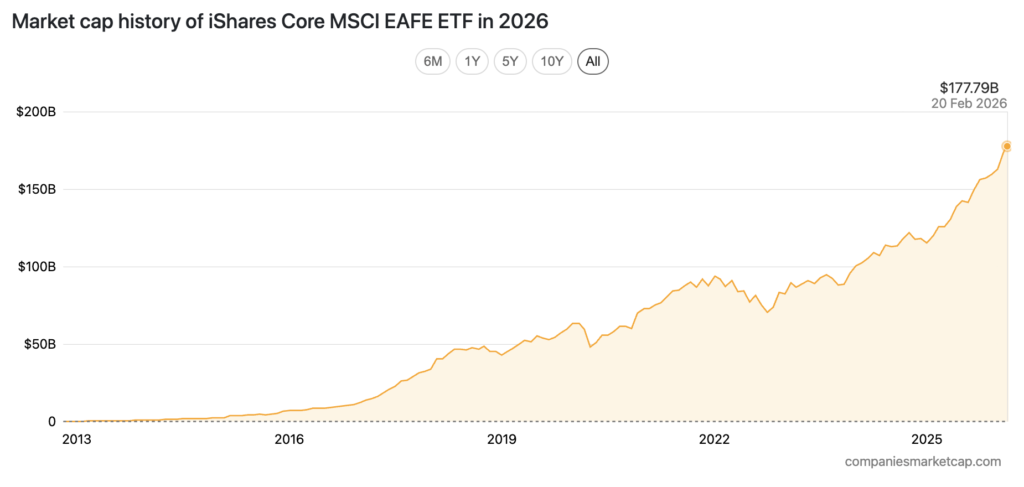
The Market Cap History of iShares Core MSCI EAFE ETF to 2026 chart shows a very strong growth trend since its launch. In the initial period around 2013-2014, the market cap of IEFA was still very small, under $5 billion. Entering 2015-2016, the value began to increase to the range of $5-10 billion, signaling the beginning of growing investor interest in this ETF.
The big surge began in 2017-2018, when its market capitalization rose sharply to close to $40-50 billion. In 2019, the market cap was in the range of $45-55 billion, before increasing again.
In the period 2020-2021, despite global market volatility, IEFA continued to grow and reached around $60-80 billion. In 2022, the value even touched the $90 billion range, although it later corrected to around $70-75 billion.
As of February 20, 2026, IEFA’s market capitalization stood at around $177.79 billion, close to the $180 billion level. Overall, the chart shows a strong long-term growth trend, with some reasonable correction phases in line with global market dynamics.
Share Price History of iShares Core MSCI EAFE ETF
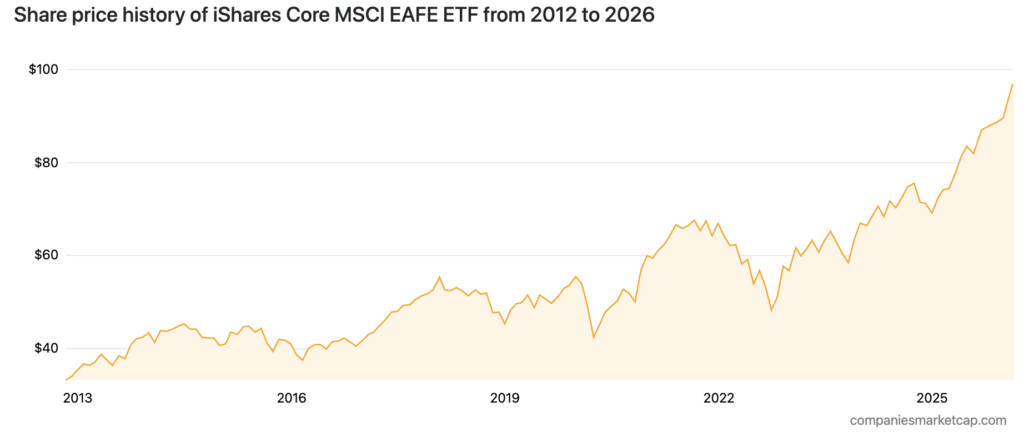
Based on the iShares Core MSCI EAFE ETF share price history chart from 2012 to 2026, it can be seen that IEFA’s share price experienced a long-term upward trend with some fairly sharp volatility phases. In the early period around 2013, the price of IEFA was in the range of $33-35. During 2014-2015, the price moved up to the $40-45 area, although it experienced a mild correction.
Entering 2016, the price weakened again to around $37-40 before gradually recovering. In the 2017-2018 period, prices showed significant gains to break the $50-55 range. However, in 2019, there was a correction that brought prices back down to the $45-50 area.
Volatility became more pronounced in 2020, when prices fell sharply to near $42, before rebounding strongly. Throughout 2021, the uptrend continued and prices reached around $65-67. In 2022, pressure returned and prices fell to the $50-55 range.
Entering 2023-2024, IEFA again showed a gradual recovery with prices moving in the $60-75 range. The strengthening momentum became more solid throughout 2025, with prices breaking $80 and continuing to rise.
By early 2026, the price of IEFA was close to $95-97, being the highest level throughout the period shown in the chart. Overall, despite several correction cycles, IEFA’s long-term trend has shown consistent growth.
IEFA Dividend and Yield Distribution
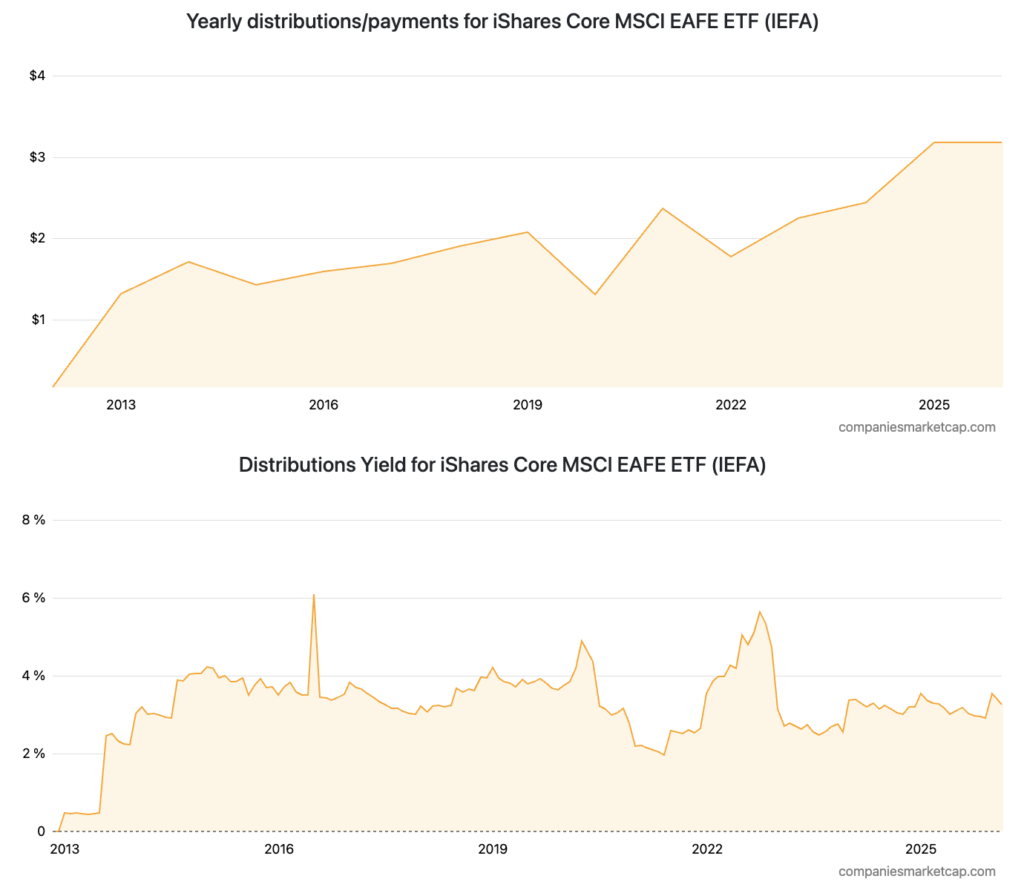
Based on the Yearly Distributions/Payments and Distribution Yield charts of iShares Core MSCI EAFE ETF (IEFA), it can be seen that the dividend distribution performance of this ETF tends to increase in the long run, although accompanied by fluctuations from year to year. In terms of the amount of annual distribution (dividend per share), in the initial period around 2013, the value was still relatively small, below $1. Then it increased to the range of $1.3-1.7 in 2014-2016. In 2017-2019, the distribution rose again and touched around $2.0.
2020 saw a decline in distributions to around $1.3. However, in 2021, the dividend payout jumped significantly to above $2.3 before fluctuating again in 2022. From 2023 to 2025, the distribution trend consistently strengthened again and in 2025-2026 reached around $3.2 per share, the highest level in the period shown.
Meanwhile, in terms of distribution yield (dividend yield), the movement looks more volatile because it is influenced by changes in stock prices. In 2014-2016, the yield was in the range of 3-4%, and even jumped close to 6% in one period around 2016.
Furthermore, in 2020-2022, the yield spiked again to close to 5-6%, which usually happens when stock prices weaken while dividends are relatively stable. However, after that, the yield drops again and moves in the range of 2.5-3.5% until 2025-2026.
IEFA Annualized Return Performance in Various Periods
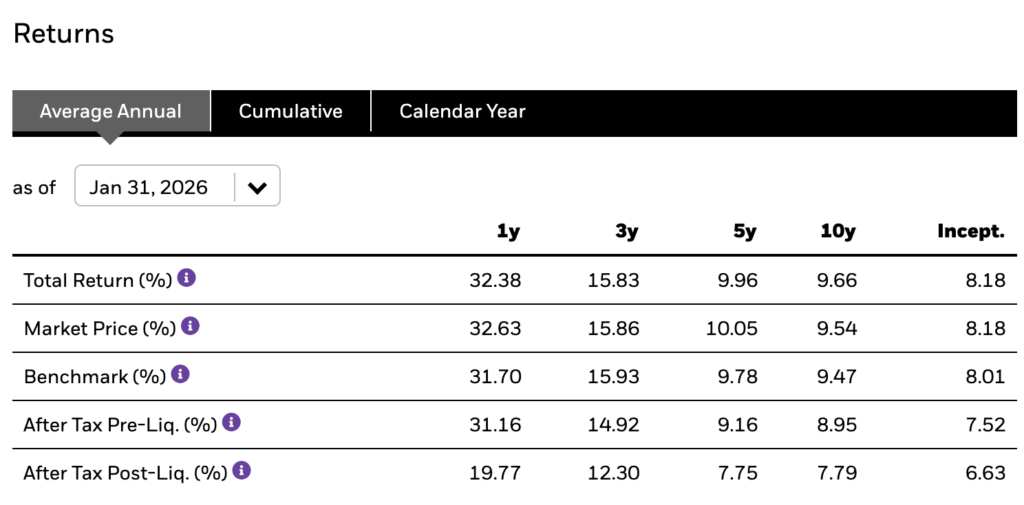
As of January 31, 2026, the performance of iShares Core MSCI EAFE ETF (IEFA) can be said to be strong, especially in terms of short-term returns and consistency in following the benchmark. In the 1-year period, IEFA recorded a total return of 32.38% (market price 32.63%), slightly higher than the benchmark of 31.70%, showing efficient tracking ability as well as competitive performance.
Over the medium to long term, performance has been relatively stable and in line with the index: around 15.83% per annum (3 years), 9.96% (5 years), 9.66% (10 years), and 8.18% since launch. However, it should be noted that after-tax, net returns are lower-for example, the 1-year post-liquidation after-tax is 19.77%.
IEFA Technical Analysis
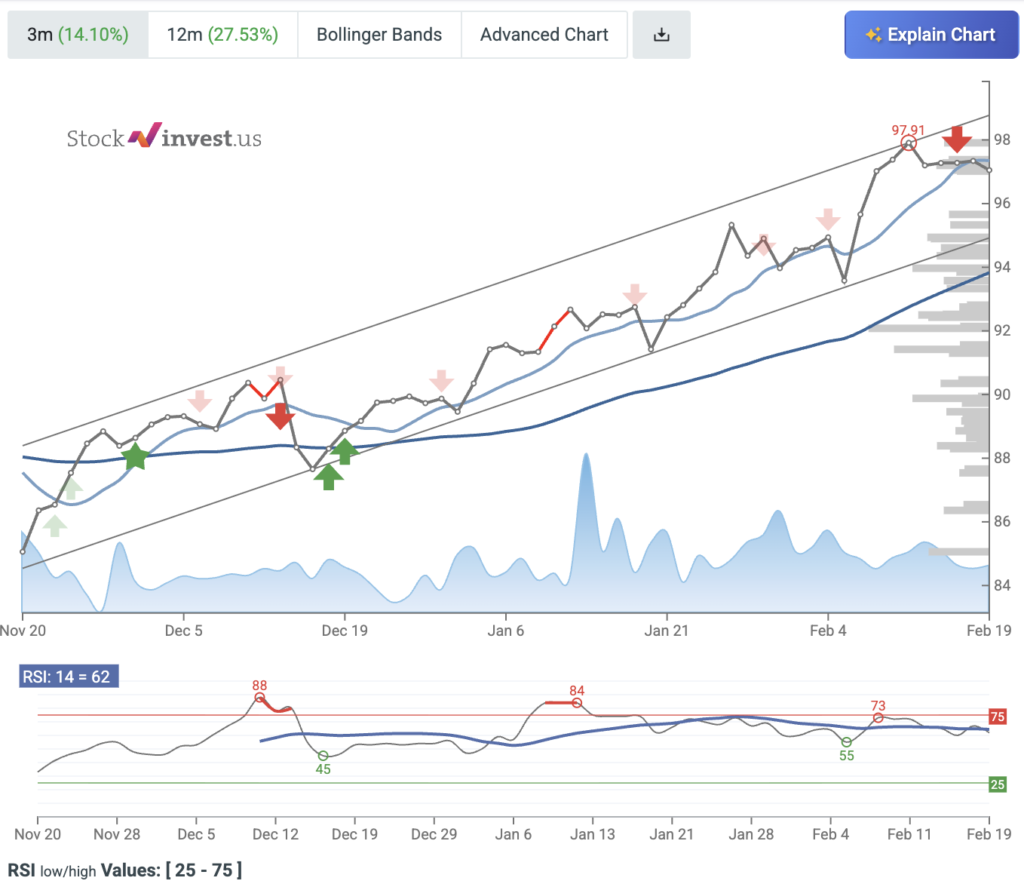
Based on the technical chart on the Stock Invest page in the period from around late November to mid-February, the price of IEFA showed a consistent upward trend within an ascending channel (gradual upward trend). Over the past 3-month period, the price recorded an increase of about 14.10% and in the past 12 months about 27.53%.
Price movement continues to form a pattern of higher highs and higher lows, which indicates that bullish momentum is still maintained. The price is currently in the area around 97-98, near the top of the trend channel, which is often a short-term resistance area.
In terms of indicators:
- TheMoving Average (blue line) continues to climb, supporting the medium-term uptrend.
- The RSI (Relative Strength Index) is at around 62, still in the neutral-bullish zone (below the overbought level of 75).
- Previously, the RSI touched the 70-84 area, signaling an overbought condition, and then experienced a healthy correction before stabilizing again.
Some of the red arrows on the chart indicate areas of short-term correction after the price hits resistance, while the green arrows mark areas of rebound from support. Volume also shows spikes at some of the sharp upside points, reinforcing the validity of the move.
IEFA Forecast According to Stock Invest
Quoting Stock Invest, based on the moving average indicator, the iShares Core MSCI EAFE ETF (IEFA) is currently showing a sell signal from the short-term average, but at the same time there is still a buy signal from the long-term average. Since the short-term average is still above the long-term average, the general picture remains in the direction of a buy signal, so the outlook is likely to be positive.
If the price continues to rise, IEFA could potentially face resistance around $97.35 (short-term moving average area). Conversely, in case of a decline, there is a chance of support around $93.83 (long-term moving average area). An upside breakout past the short-term average could strengthen the buy signal, while a drop through the long-term average risks a sell signal.
In addition, the 3-month MACD indicator is also giving a buy signal. However, some negative signals have also emerged that could affect the movement in the very short term. For instance, on Wednesday, February 11, 2026, a sell signal was formed from the pivot top, and since then the price has dropped by around 0.88%. As long as a new bottom pivot has not been formed, there are still indications of continued downward pressure.
Another thing to look out for: the volume increased when the price dropped on the last trade. This could be an early warning that selling pressure is building, so IEFA’s movements should be monitored more closely.
Conclusion
To conclude, the iShares Core MSCI EAFE ETF (IEFA) is a global index ETF designed to provide exposure to developed stock markets outside the United States and Canada-including Europe, Australasia (Australia & New Zealand), and the Far East. With a very broad portfolio (around 2,614 stocks) and relatively low concentration (the 10 largest holdings are around 11.4%), IEFA offers strong diversification for investors looking to expand their portfolio into international markets.
In terms of product profile, IEFA stands out due to its low cost and passive index-following nature, so its performance tends to be stable and close to the benchmark over the long term. Historical data also shows solid growth in terms of price, market cap, and dividend distribution, although it has experienced a reasonable correction phase in line with global market dynamics and exchange rate movements.
Disclaimer: All articles from Pintu Academy are intended for educational purposes and do not constitute financial advice.
Reference:
- AAII. ETF Evaluator: iShares Core MSCI EAFE ETF (IEFA). Accessed on February 20, 2026
- BlackRock Advisor Center. iShares Core MSCI EAFE ETF. Accessed on February 20, 2026
- Companies Market Cap. Accessed on February 20, 2026
- Kevin Shan. IEFA: Understanding How IEFA Offers Developed Market Exposure Beyond The U.S. And Canada. Accessed on February 20, 2026
- Stock Invest. Ishares Core Msci Eafe Etf ETF Forecast. Accessed on February 20, 2026
Share
Related Article


See Assets in This Article
IEFAON Price (24 Hours)
Market Capitalization
-
Global Volume (24 Hours)
-
Circulating Supply
-