Golden Opportunity to Buy Bitcoin (BTC) at January 2026 Discount Price, Check out the Analysis!

Jakarta, Pintu News – In the world of cryptocurrency investment, understanding the right time to buy is key. Based on the Bitcoin rainbow chart model, Bitcoin is currently showing an interesting ‘fire sale’ signal. With the current price around $95,000, many analysts see this as a favorable buying zone for medium-term investors. Is this the right time to consider buying?
Bitcoin Rainbow Chart Analysis
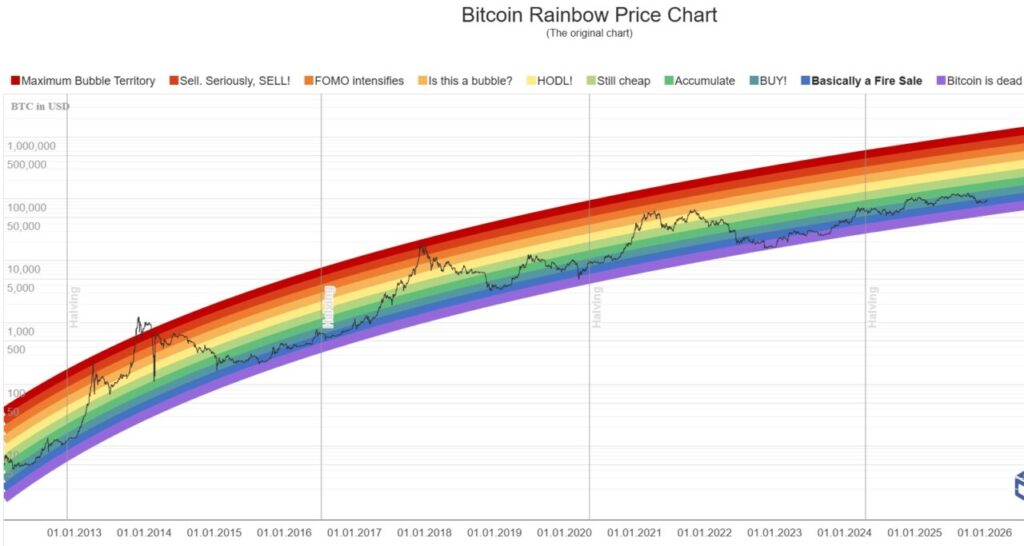
The Bitcoin rainbow chart is a tool used to identify key inflection points and valuation-based market cycle patterns. Currently, the chart shows that Bitcoin (BTC) is in a very attractive zone to buy. The last time a similar signal appeared was in the second half of 2024 and the first quarter of 2025, where Bitcoin (BTC) experienced significant gains.
If past trends are repeated, there is upside potential of up to 60% with the ‘accumulate’ zone estimated at $150,000 to $160,000. However, it is possible that the price of Bitcoin (BTC) could drop deeper into the $65,000 to $75,000 range, a zone often considered the lowest point in previous bear market cycles. This could be a better buying opportunity if the four-year cycle is still relevant and history repeats itself.
Also Read: Monero (XMR) sets new record, will it continue to surge in January 2026?
Market Dynamics and Demand for Bitcoin (BTC)
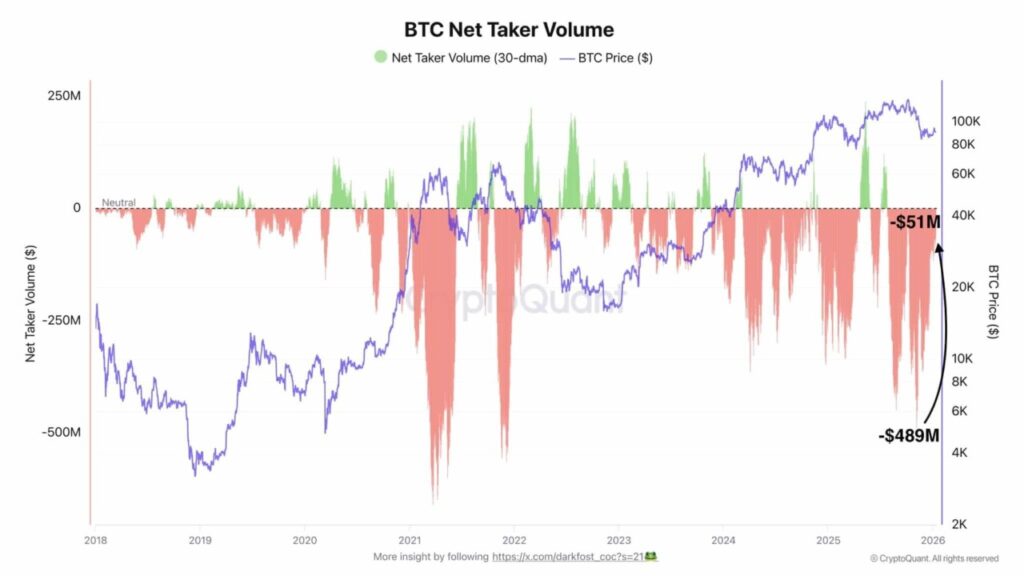
According to analysts from CryptoQuant, DarkFost, selling pressure in the derivatives market has decreased dramatically, from nearly $500 million to just $51 million, a drop of nearly 90%. This signals a potential bullish reversal if net buyer volume returns to positive. Meanwhile, the spot market is showing slight improvement with demand from corporate treasuries recovering.
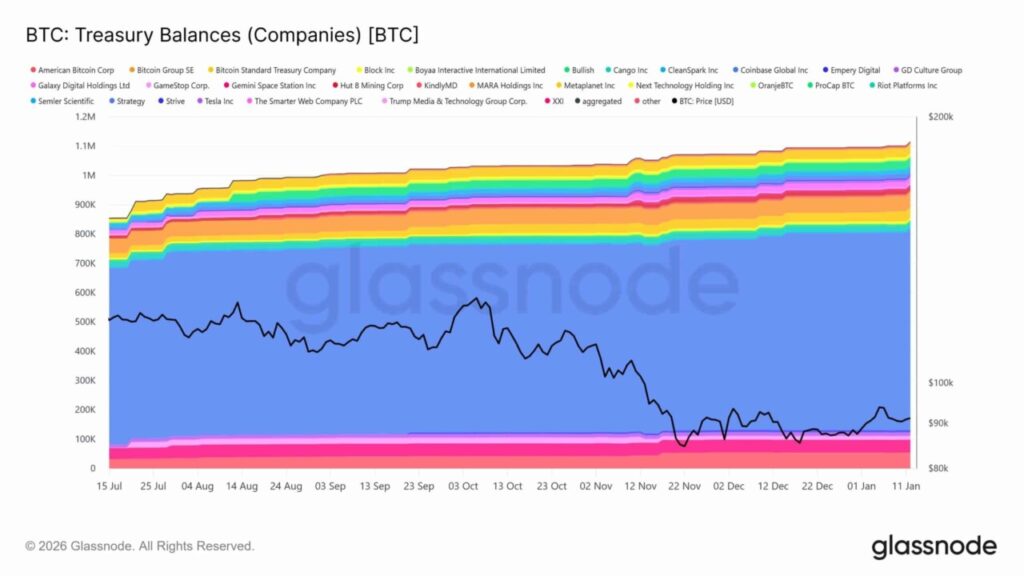
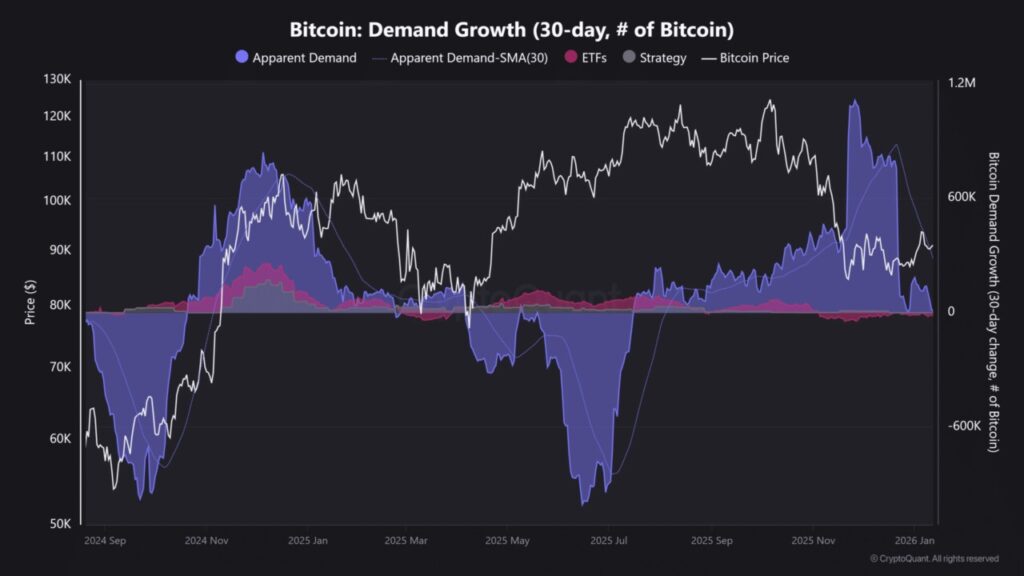
The public company has added about 43,000 BTC per month over the past six months. However, the current price consolidation in the range of $85,000 to $95,000 has absorbed a significant distribution of legacy Bitcoiners and ETFs. At the start of 2026, US spot Bitcoin (BTC) ETF inflows showed mixed results. The overall demand for Bitcoin (BTC), including ETFs and corporate treasuries, is still low, which reduces confidence among bulls.
Conclusion and Investment Advice
Analyzing various market dynamics and predictive models such as the Bitcoin rainbow chart, now or during a further decline to the $65,000 to $75,000 range, could be a profitable buying window. Investors are advised to monitor market indicators and trading volumes to make informed decisions.
With significant upside potential and reduced selling pressure, this period could be a good opportunity to consider adding Bitcoin (BTC) to an investment portfolio.
Also Read: 7 Crypto Oversupply Signals Could Reset Bitcoin to $10,000 – Here Are the Indicators!
Follow us on Google News to get the latest information about crypto and blockchain technology. Check Bitcoin price today, Solana price today, Pepe coin and other crypto asset prices through Pintu Market.
Enjoy an easy and secure crypto trading experience by downloading Pintu crypto app via Google Play Store or App Store now. Also, get a web trading experience with various advanced trading tools such as pro charting, various types of order types, and portfolio tracker only at Pintu Pro.
*Disclaimer
This content aims to enrich readers’ information. Pintu collects this information from various relevant sources and is not influenced by outside parties. Note that an asset’s past performance does not determine its projected future performance. Crypto trading activities are subject to high risk and volatility, always do your own research and use cold hard cash before investing. All activities of buying andselling Bitcoin and other crypto asset investments are the responsibility of the reader.
Reference
- AMB Crypto. Bitcoin Rainbow Chart Flash Fire Sale: Should You Jump In? Accessed on January 15, 2026
Latest News

UBS Gold Price Today, April 29, 2026