4 Crypto Trading Indicator You Should Know

The cryptocurrency asset market is one with a high level of volatility. Crypto prices often fluctuate and change drastically within just 1 day. Therefore, trading in such a scenario is difficult. Professional traders understand that they need proper analysis to make a profit. One of the important tools in analyzing the price of crypto assets is a trading indicator. From identifying patterns, predicting prices, to understanding trends, trading indicators can provide a lot of important information. So, what is a trading indicator and how do you use it? This article will discuss the best indicators for crypto trading that you should pay attention to.
Article Summary
- 📏 a trading indicator is a mathematical calculation for identifying trends and important price points of an asset.
- 🧮 Analyzing data charts and using trading indicators to make decisions falls into the category of technical analysis.
- ⚖️ Some important trading indicators that can help you make decisions are Moving Average (MA), Moving Average Convergence Divergence (MACD), Relative Strength Index (RSI), and Bollinger Band . These are some of the most popular and fundamental indicators in cryptocurrency.
- 💸 One of the most important things when it comes to technical indicators is that each one displays different pieces of information. The best way to use it is to combine several indicators to get the big picture.
Also read: Tips for Choosing the Right Crypto Trading Technique for You
What is a trading Indicator?
A trading indicator is a mathematical calculation for identifying the trends and important price points of an asset. Without using indicators, novice traders will find it difficult to determine the current trend when looking at the price chart. Think of these indicators as a different map of the same area. Each map provides a variety of information to find certain points in the price chart like trends or target prices.
The use of trading indicators to see patterns and price trends is called technical analysis. Technical analysis is one of several strategies commonly used by investors and traders when they want to enter a position or choose assets. Traders use indicators to get confirmation whether their predictions are correct or not.
There are hundreds of trading indicators that you can use to analyze price charts. However, some of the indicators discussed in this article are fundamental indicators because they are used by all traders, professionals and beginners. Here are some of the best indicators for crypto trading that can help you predict the direction of asset prices based on various calculations.
Moving Average (MA)
Moving Average/Simple Moving Average (MA/SMA) is an indicator that shows the movement of asset prices when averaged over a certain period of time. For example, the 20-day MA shows the average line of price movement over the last 20 days. This makes it easier for traders to see price trends. MA is divided into several types, namely Weighted (WMA), Exponential (EMA), and Smoothed (SMMA). However, the most popular MA indicators are MA and EMA.
SMA is a technical indicator that is useful for predicting price trends based on historical prices. However, the MA indicator is commonly referred to as a lagging indicator because it is not very responsive to rapid price changes. In this case, the Exponential Moving Average (EMA) is more accurate because it assigns a higher weight and significance to newer prices than the SMA (the SMA assigns the same weight to all prices) so it moves relatively quickly to changing prices.
EMA line
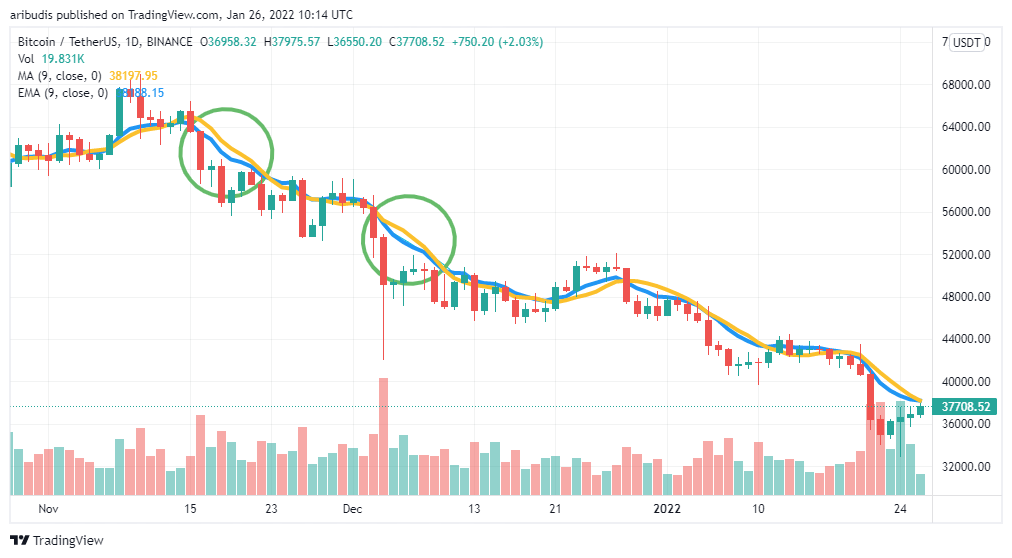
In the picture above, you can see that the EMA (blue line) indicator is moving closer to the asset price movement than the MA (yellow line). In addition, the movement of the EMA line is more accurate in terms of depicting the decline in the price of Bitcoin which fell from the price of $64 thousand to the level of $60 thousand. The image above also shows the usefulness of the EMA in identifying a downward trend in price.
One of the basic principles of using EMA is to know that when the asset price falls below the EMA line, it indicates a downward trend or bearish.
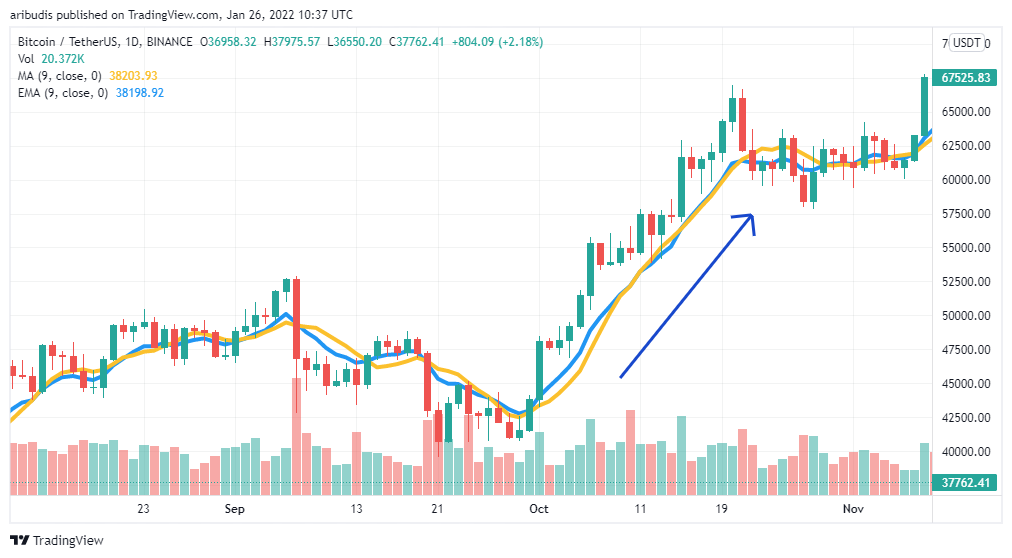
On the other hand, if the asset price rises above the EMA line, it indicates an upward trend or bullish. This is a principle and the basic application of using EMA for identifying price trends. In general, traders divide the EMA line into several time periods such as the 20-day, 50-day and 100-day EMA. This difference is used to see short-term trend movements and also to determine support and resistance levels.
SMA and the EMA line is one of the best indicators for crypto trading and most traders use them. However, like any technical indicator, it cannot be used as the only tool for predicting trends. The EMA trading indicator will be more accurate when combined with other indicators.
Also read: What is Support and Resistance in Crypto?
Relative Strength Index (RSI)
The Relative Strength Index (RSI) is an indicator that shows price momentum. It works like a pendulum swinging from side to side using a 0-100 number measurement. A number of 0-30 indicates an oversold momentum, which means an asset has reached the maximum point of price decline and it will experience a trend reversal. On the other hand, the number 70-100 indicates an overbought momentum, which means that the asset price has reached the maximum point of a price increase and will experience a correction as a reversal trend.
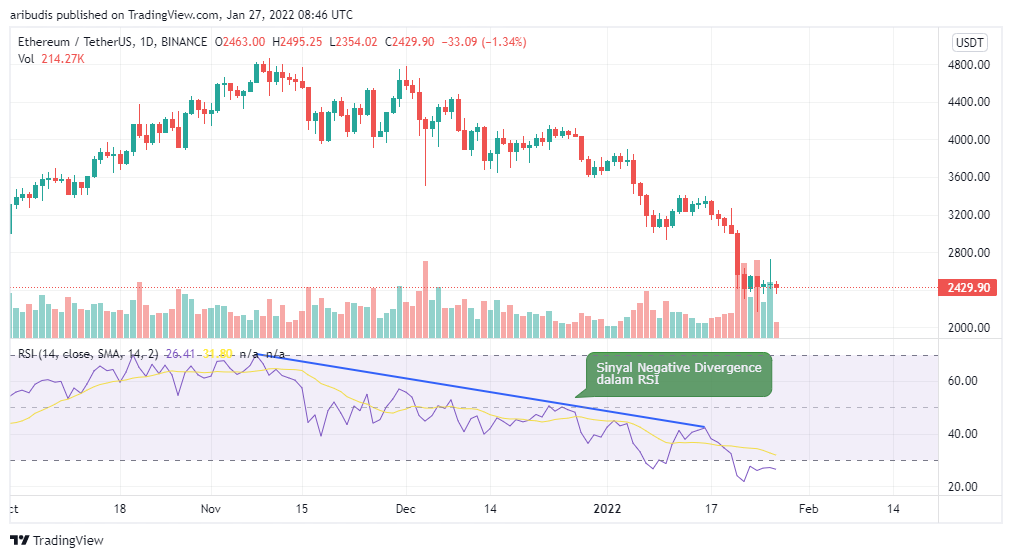
The RSI is one of the most popular indicators to identify changes in trends from upward momentum to downward momentum and vice versa. A negative divergence occurs when the RSI and other indicators indicate that the price will decline, even though the chart shows the price is stable or tends to rise. The Ethereum price chart above is a perfect example of how the price finally followed the momentum of the RSI indicator. However, because it is a momentum indicator, the RSI can only predict the direction of the change but not the price.
An RSI is one of the best indicators for crypto trading. However, like other indicators, the RSI will not always provide accurate predictions, especially in the short term. Expert traders understand that the RSI is something that should be used with other indicators such as EMA or MACD.
Moving Average Convergence Divergence (MACD)
Moving Average Convergence Divergence (MACD) is a technical indicator that is formed based on the momentum of two EMAs, namely EMA 12 and 26. This calculation creates a MACD line starting from negative to positive numbers. Like RSI, MACD is a momentum indicator to identify trend changes, signals to buy and sell, and trending movements. The MACD indicator itself consists of a MACD line, signal line, and Histogram chart. When you want to use MACD, there are some general principles that you should pay attention to.
- Positive MACD (above the histogram) = Indicates an uptrend momentum (price rise).
- Negative MACD (below the Histogram) = Indicates the momentum of a downtrend (price decline).
- Bullish crossover = If MACD rises and crosses the Signal Line, it is a sign of bullish momentum.
- Bearish crossover = If MACD falls and crosses below the Signal Line, bearish momentum is forming.
MACD is one of the most popular technical indicators used by traders as well as investors looking for signals to buy an asset.
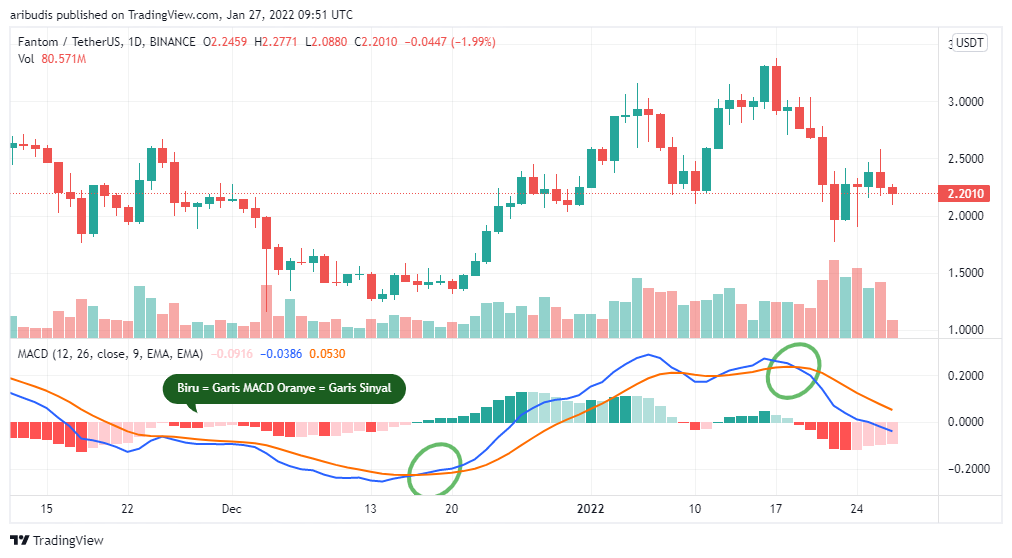
Spotting trend change using MACD
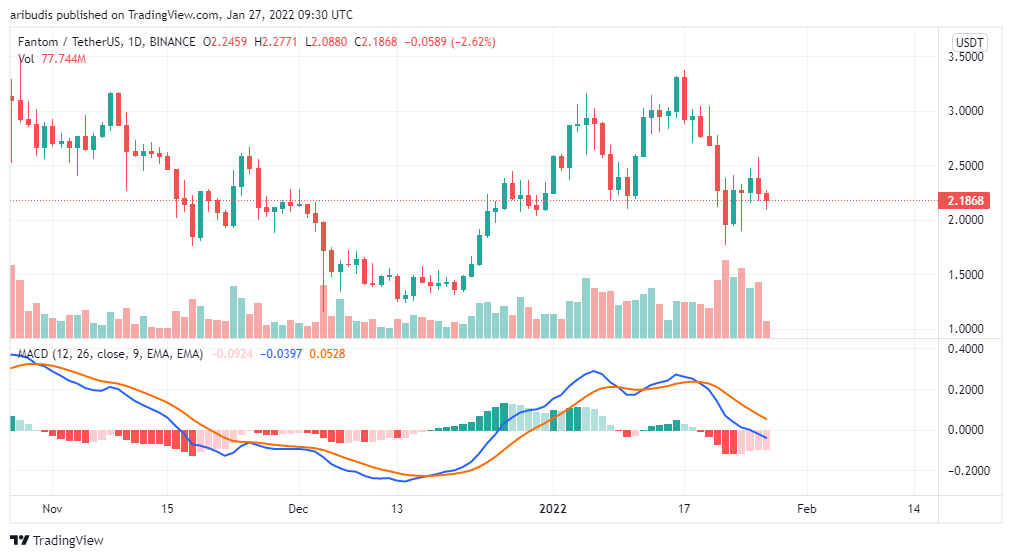
Using the image above, we can see the movement of the MACD (Blue) line following very closely to the original price of the asset Fantom (FTM). The two circles in the picture above indicate a trend change, a bullish crossover and then a bearish crossover.
In the first circle, it can be seen that the MACD line (blue) started to rise and then crossed the signal line and histogram. This indicates bullish crossover, a positive trend change as indicated by the price chart of Fantom rising from $1.5 dollars to $3 dollars. On the other hand, the second circle shows a bearish crossover event which indicates a negative trend change. The MACD line is descending and crossing downwards, shown by the price dropping from $3 dollars to $2 dollars.
Many traders consider MACD to be one of the most reliable technical indicators. It is one of the best indicators for crypto trading as it can provide signals to buy and sell assets following the trend. However, these trend change signals are not always accurate, just like the RSI. You need to combine MACD with other indicators in order to have complete information.
Bollinger Bands (BB)
Bollinger Bands (BB) is a technical indicator created by John Bollinger, a technical analysis expert. The indicator consists of 3 elements, the SMA 20 line in the middle, upper band, and lower band. The main objective of BB is measuring the volatility by the narrowing and widening of the two bands. The higher the volatility, the wider the two bands of the Bollinger Band stretches and vice versa. Visually, the BB Indicator forms a ‘blanket’ against the price chart.
John Bollinger himself explained that his own indicator is not recommended to be used by itself. It is one small piece that will make up the big picture. John Bollinger suggests using BB in conjunction with MACD, RSI, and OBV (an indicator that shows an increase or decrease in volume).
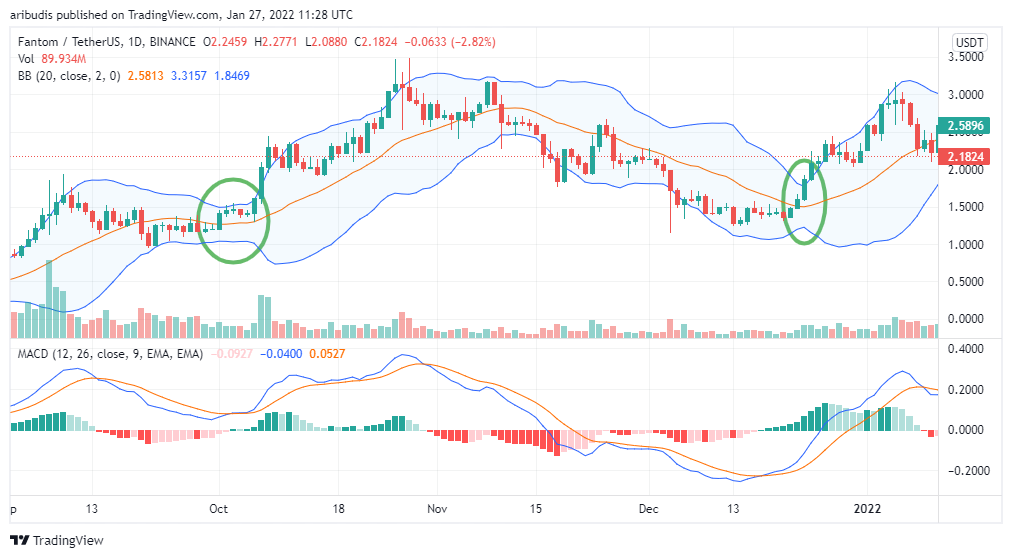
However, we can still use Bollinger Bands to get certain information from the price chart. A squeeze is a situation where the upper and lower limits of BB narrow which indicates a decrease in volatility. A squeeze will be followed by a widening of the two bands which indicates that an uptrend or downtrend will occur. The circle in the picture above shows the occurrence of squeeze (October and late December) which is then followed by a widening of the BB limit to indicate an upward price trend.
BB can only see signs of a trend change but can’t tell which direction the trend will change. However, when combined with indicators such as EMA and MACD the direction of the trend change can be seen more clearly. Traders can capitulate with these indicators to then enter or exit a position.
FaQ
1. What are the advantages of reading candlestick charts compared to regular line charts?
Candlestick charts provide more detailed information—open, close, high, and low prices—allowing traders to better understand market sentiment and trend strength compared to line charts, which only show closing prices.
2. Are all candlestick patterns equally effective across all types of markets?
No, the effectiveness of candlestick patterns depends on market context and asset volatility; a pattern that works well in the crypto market may not be as reliable in stocks or commodities.
3. Can candlestick charts be trusted without volume indicators like OBV or Pivot Points?
Candlestick analysis can still be useful without volume indicators, but it becomes more accurate when combined with tools such as OBV or Pivot Points to confirm trend strength.
4. How important is the timeframe when reading candlestick charts?
Timeframe is crucial because it defines the context of price movements; daily charts reveal long-term trends, while 5-minute charts reflect only short-term volatility.
References:
- Rakesh Upadhyay, Here are 2 key price indicators every crypto trader should know, Coin Telegraph, accessed on 25 January 2022.
- Technical Analysis 101: The Best Technical Indicators for Crypto and Stocks | Alexandria, Coin Market Cap, accessed on 25 January 2022.
- Exploring Cryptocurrency Trading Indicators: What are Crypto Trading Indicators?, Moralis Academy, accessed on 26 January 2022.
- Jason Fernando, Moving Average Convergence Divergence (MACD) Definition, Investopedia, accessed on 27 January 2022.
- Adam Hayes, Bollinger Band® Definition, Investopedia, accessed on 27 January 2022.
Share
Next Article

The transparency of crypto assets such as Bitcoin is one of the benefits that make them appealing to investors. Because it means that anyone can monitor the movement of Bitcoin supply and demand and the activity on the Bitcoin network, which will affect the price. This is why to be able to maximize profits from […]
Related Article


See Assets in This Article
BB Price (24 Hours)
Market Capitalization
-
Global Volume (24 Hours)
-
Circulating Supply
-