Market Analysis 26 September – 3 October: Market Fears Recession, Bitcoin Might Lose Its Important Support Level
October has been a historically strong month for Bitcoin over the past couple of years. However, BTC closed out September with a negative return, and it might just lose its previous 3 months’ support.
This Market Analysis presents essential information that Pintu’s trader team has gathered on the cryptocurrency market over the previous week. However, you need to note that all information in this Market Analysis is intended as informational and educational content, not financial advice.
Market Analysis Summary
- The S&P 500 closed out its worst month since March 2020 on Friday. Historically crypto market is heavily correlated to the S&P.
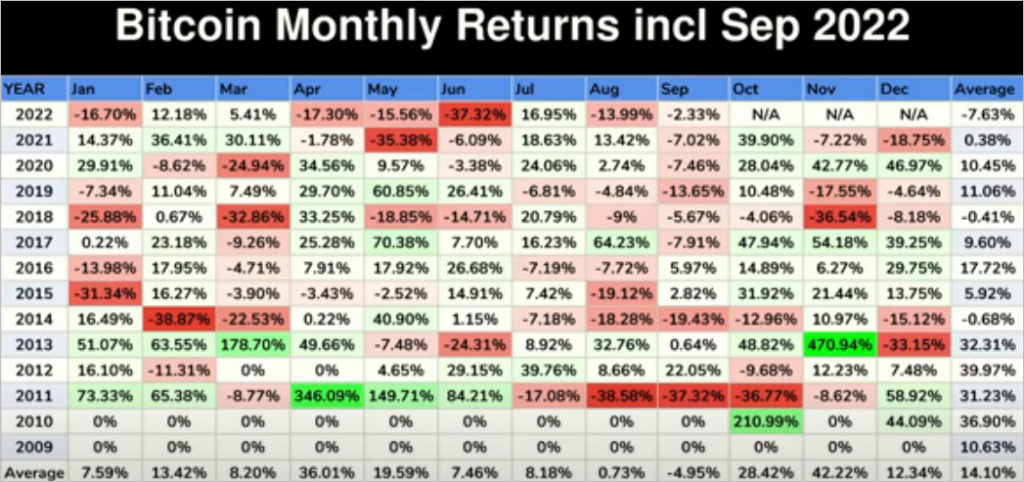
- We ended September with a negative return for BTC. However, October has historically been a positive month for BTC.
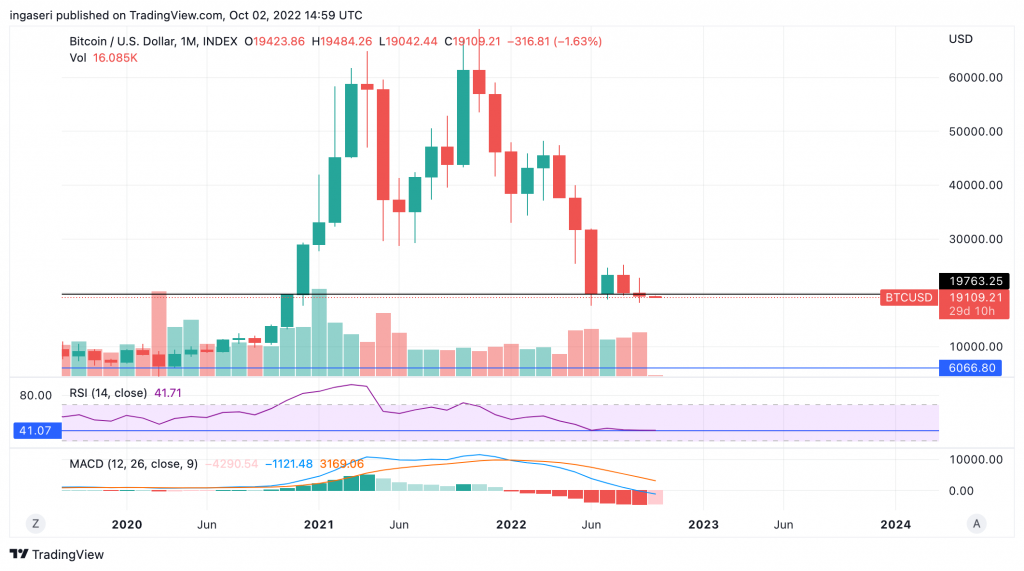
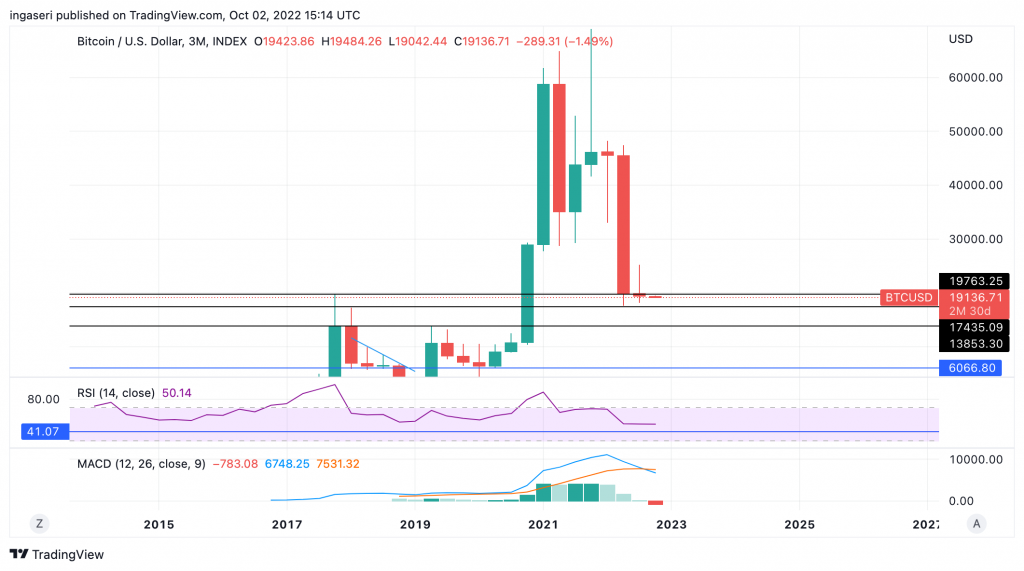
- As BTC closed the September monthly candle, we can see that BTC might just lost its previous 3 months’ support. Meanwhile, in the quarterly chart, we have flipped the previous support line into new resistance.
Macroeconomy Analysis
The S&P 500 closed out its worst month since March 2020 on Friday. The Dow Jones Industrial Average and the Nasdaq Composite fell 8.8% and 10.5%, respectively, for the month. Historically Crypto market is heavily correlated to the S&P, we need to watch for more downturns in the capital market.
Are we in recession yet? Let’s look at multiple factors:
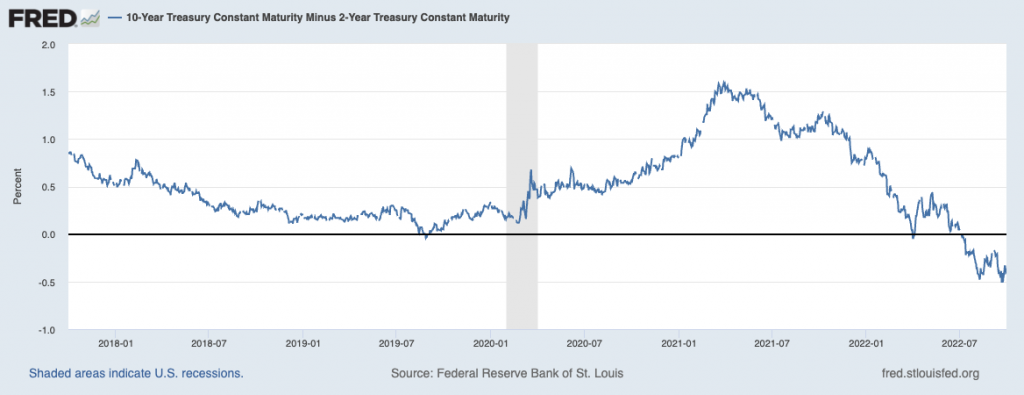
Inverted yield curve:
When the yield on a short-term Treasury, such as the 2-year Treasury, is lower than the yield on a 10-year Treasury, This produces the inverted yield curve. This situation is strange because locking up shorter length of time produces higher yield than that of longer one. In general, inverted yield curves indicate that investors anticipate a downturn. Recessions frequently precede inverted curves. Currently, the 10-year Treasury yield is lower than that of 2-year.
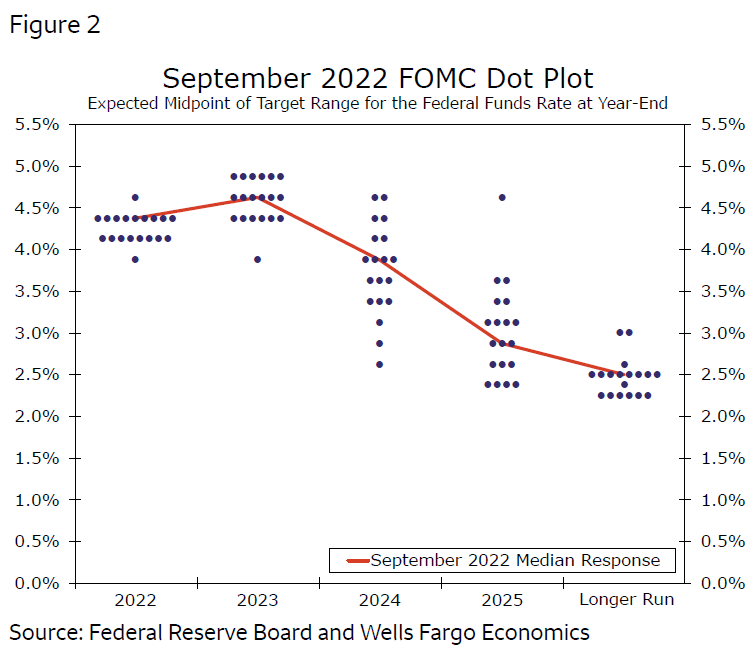
Interest rate:
The economy’s two warning indicators: slowing growth and high hiring has always been vital sign for the recession.
The Fed raised the federal funds rate by 75 bps to the 3%-3.25% range during its September meeting, the third straight three-quarter point increase and pushing borrowing costs to the highest since 2008. The so-called dot plot showed interest rates will likely reach 4.4% by December, above 3.4% projected in June, and rise to 4.6% next year. Meanwhile, GDP growth forecasts were revised lower to show a 0.2% expansion this year, compared to 1.7% seen in June and 1.2% in 2023, below 1.7% seen in June. Inflation as measured by Personal Consumption Expenditure (PCE) is seen to reach 5.4% in 2022 (5.2% projected in June) and 2.8% in 2023 (vs 2.6%).
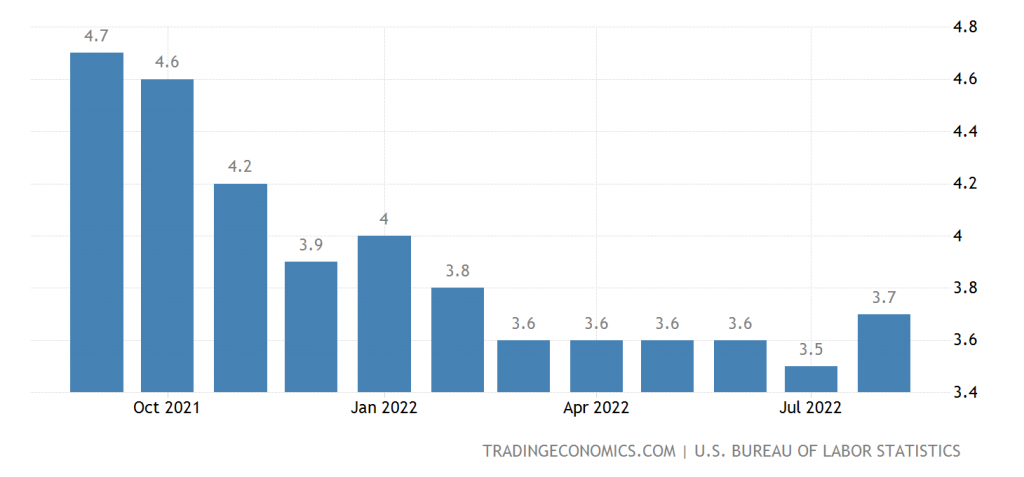
Unemployment:
Recession is usually accompanied by high (increasing) unemployment. Based on past datas. Fed believed that we are not in a recession (although technically so) because of the strength of the labour market. What is interesting is that the recession ends near the peak of the unemployment rate, before it starts to reverse again. Numerous analysts keep track of the number of people who apply for unemployment benefits each week because it shows if layoffs are becoming worse or not. The number of weekly applications for unemployment benefits has decreased to a five-month low. The current US unemployment rate rose to 3.7 percent in August of 2022, the highest since February and above market expectations of 3.5 percent.
Bitcoin Price Movement 26 September – 3 October 2022
We end the month of September with negative return for BTC. This marks the 6th consecutive September that bitcoin been negative. What is interesting though, is that October has been mostly green, especially during the past couple of years. Historically Q4 has been the best quarter as compared to all other period in a year.
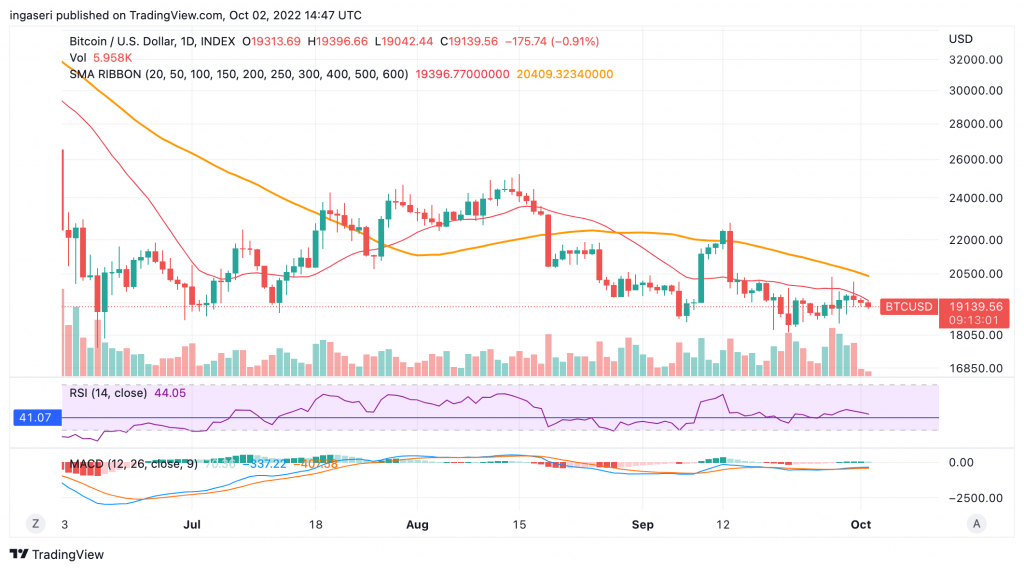
BTC still find 20 days MA (red line) as resistance since Mid September, we have been hovering below it for 2 weeks now, and have not find any strong momentum to overcome it. We would see a sideways-bear price action until we find ourselves above this resistance line.
As BTC closed the September monthly candle, we can see that BTC might just lost its previous 3 months support at precisely 19,700. The line is flipping into resistance which could reject price into downside continuation.This sort of price positioning suggests that BTC is setting itself up for a technical breakdown from the 20K-23.5K range, home to a four-month consolidation period at these prices.
Interestingly, we see similar outcome on the quarterly candle. We can see the 2nd quarter, BTC was able to hold support at the line. The previous quarter however, we have flipped the line into a new resistance. As mentioned in previous weekly analysis, price support at 17,500. A drop below this price support could cause a significant decline towards the next price support at 14,000.
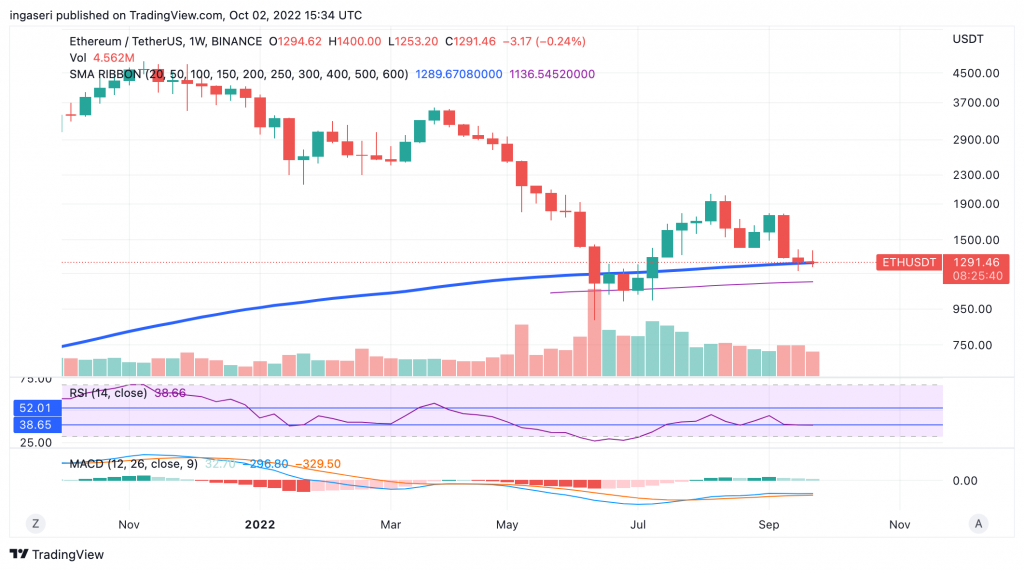
Ethereum Price Movement 26 September – 3 October 2022
ETH is trading sideways. On the weekly chart, we can see it still hold 200 weeks MA as support. If we were to lose this support line, next support will be at 1150 price point. The RSI has been on the support level of 39 throughout this 2 weeks.
On-Chain Analysis
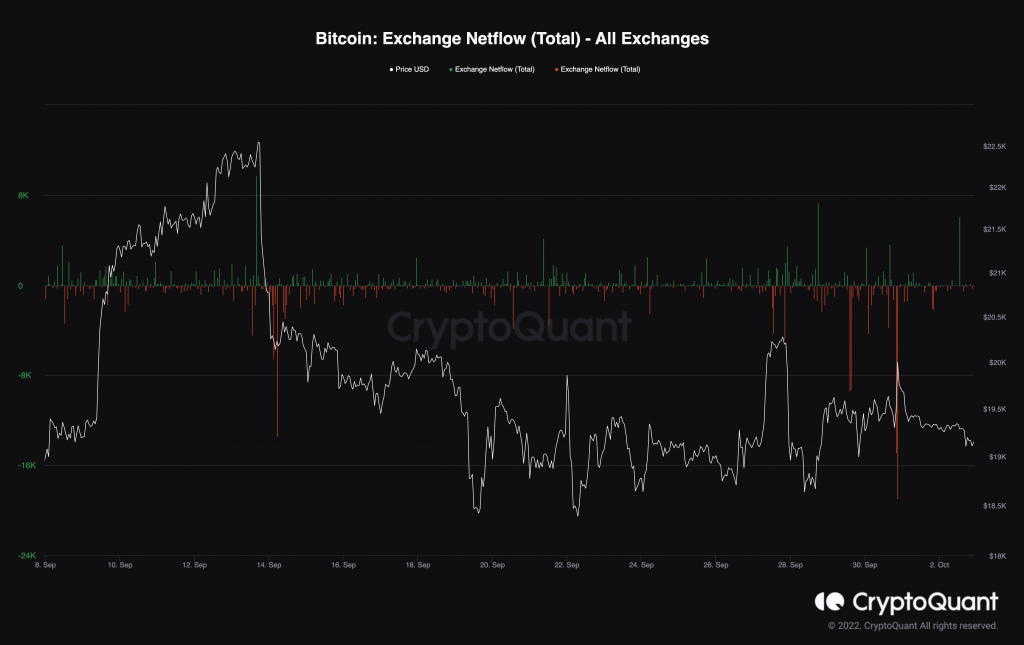
On the 30th September, we experience a high net outflow of exchanges. Previously, when we do so, we can see that it creates a positive momentum for the price. Exchange reserves have decreased by more than 60,000 BTC during the last three days. This is a positive sign. After months of lowering prices, this is a sign of demand returning to the market after months of price declines. While exchange outflows remain positive, less supply on exchanges might imply lower selling pressure by market participants.
📊 Exchange Reserve: As the exchange reserve continues to fall, it indicates lower selling pressure. Net deposits on exchanges are high compared to the 7-day average. Higher deposits can be interpreted as higher selling pressure.
💻 Miners: Miners’ are selling holdings in a moderate range compared to its one-year average. Miner’s revenue is in a moderate range, compared to its one-year average.
🔗 On-Chain: More investors are selling at a loss. In the middle of a bear market, it can indicate a market bottom. Long term holders’ movement in the last 7days were lower than the average. They have a motive to hold their coins. Investors are in a capitulation phase where they are currently facing unrealized losses. It indicates the decreasing motive to realize loss which leads to a decrease in sell pressure.
🏦 Derivatives: Long position traders are dominant and are willing to pay to short traders. Buying sentiment is dominant in the derivatives market. More buy orders are filled by takers. As open interest increases, it indicates more liquidity, volatility, and attention are coming into the derivative market. The increasing trend in OI could support the current ongoing price trend.
Altcoin News
- ✅ Cardano deploys ‘Vasil’ Upgrades. Cardano successfully deployed a ‘Vasil’ upgrade that aims to improve smart contract performance and network throughput. The performance improvements are expected to benefit decentralized finance applications built on Cardano, and several are set to launch in the coming weeks.
- 🎮 Solana (SOL) NFT Game Star Atlas Launches Playable Demo. Star Atlas just rolled out its first playable demo via the Epic Games Store. The developer also released a toolkit to make it easier for other developers to bring their own Unreal Engine 5-based games to the Solana blockchain.
More News from Crypto World in the Last Week
- 🏛️ Christie’s launches on-chain NFT auction platform. After a series of successful high-priced nonfungible token (NFT) sales, Christie’s has launched its own dedicated NFT “on-chain auction platform,”. The Christie’s 3.0 allows for NFT auctions to be conducted entirely on the Ethereum network “from start to finish”.
- 🖼 The weekly trading volume of NFT has plunged to 114,4 million US dollar. According to Dune Analytics, the weekly trading volume of NFTs, across the blockchain realm has plunged to $114.4 million or a decrease of 98% from the $6.2 billion around the end of January. However, the number of wallets owning at least one NFT has skyrocketed to 6.14 million, compared to 3.36 million at the end of January
- 🚨 South Korean authorities order freeze of $67M of Bitcoin tied to Do Kwon. After added him to Red Notice list, South Korean authorities ****have requested crypto exchange OKX and Kucoin to freeze 3.313 BTC reportedly tied to Do Kwon, the co-founder of Terra blockchain developer Terraform Labs.
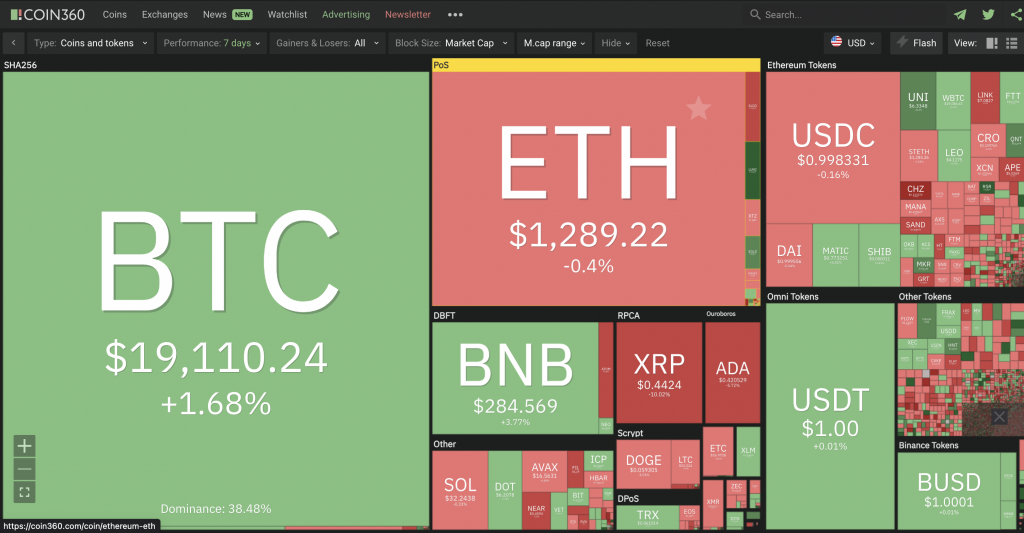
Cryptocurrencies Market Price Over the Past Week
Cryptocurrencies With the Best Performance
- Quant (QNT) +12.82%
- Uniswap +11.41%
- Maker (MKR) +9.25%
- Elrond (EGLD) 6.62%
Cryptocurrencies With the Worst Performance
- Chiliz (CHZ) -16.11%
- ApeCoin (APE) -11.52%
- Chainlink -8.06%
- 1Inch -7.79%
Reference
- Jesse Coghlan, Christie’s moves on-chain with NFT auction platform on Ethereum, Coin Telegraph, accessed on 30 September 2022.
- Zhiyuan Sun, NFT trading volume plunges 98% from January despite rise in adoption, Coin Telegraph, accessed on 30 September 2022.
- Andrew Hayward, Solana NFT Game Star Atlas Launches Playable Demo on Epic Games Store, The Decrypt, accessed on 30 September 2022
- Aleksander Gilbert, Cardano Deploys ‘Vasil’ Upgrade, The Defiant, accessed on 30 September
- Prashant Jha, Report: Korean authorities order freeze of $67M of Bitcoin tied to Do Kwon, Coin Telegraph, accessed on 30 September 2022
Share
Related Article


See Assets in This Article
Bitcoin Price (24 Hours)
Market Capitalization
-
Global Volume (24 Hours)
-
Circulating Supply
-