Crypto Market Report: Q3 2022

The second quarter of 2022 was filled with chaotic events in the Crypto market such as the fall of Terra alongside the insolvency of Celsius and 3AC. These events, coupled with macroeconomic situations that are less supportive, make Q2 2022 like hell for the crypto market. After these events, we experience a stagnant period in which many crypto assets began to move sideways. However, there is no rest for the cryptocurrency market. Crypto projects announced various important news in the third quarter of 2022. The Crypto Market Report in the third quarter will summarize what happened in the last three months.
Article Summary
- 📉 Bitcoin closed with negative yields at the end of Q3 2022, with a price reduction of 2.63% compared to Q2 2022.
- ❗ The success of The Ethereum Merge is not followed by the positive movement for the price of ETH as previously expected.
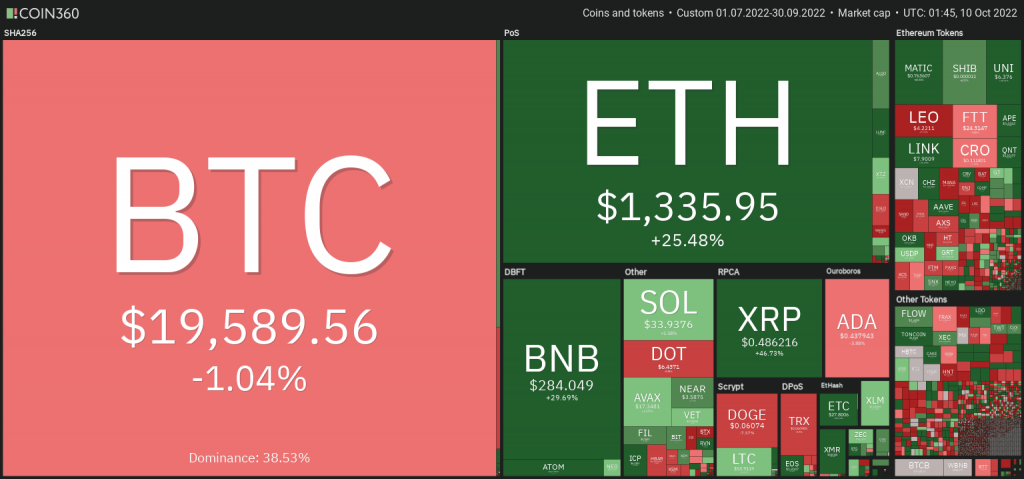
- 💰 Crypto market capitalization in Q3 2022 is sitting around the range of 1 trillion US dollars.
- 📊 Crypto Layer-1 competition is quite fierce. Binance Chain and Solana have the highest user activity compared to others. Meanwhile, Ethereum still dominates the revenue number for blockchain networks.
- 〰️ The Defi, NFT, and Gamefi markets are trying to recover from the chaos of the second quarter where they decline significantly. Like other crypto sectors, the three are experiencing stagnation.
- 📈 With a very high inflation rate, The Fed is likely to once again rise the interest rate for 75 BPS at the November FOMC meeting.
- ⚖️ There are various important milestones for several crypto projects in Q4.
What Happened in the Last Three Months?
After the chaos of Q2, the Crypto market began to consolidate and recover in the third quarter. The most popular narrative in the crypto industry in the third quarter is The Merge Ethereum. In addition, Crypto market players also always await the announcement of the Fed policy related to inflation and interest rates. Both of these have a big influence on the movement of Bitcoin and other altcoin prices.
Bitcoin and Ethereum dropped dramatically in Q2 2022 with a decrease in the quarter-to-quarter by around -56% for BTC and -67% for ETH. Meanwhile, in Q3 2022 BTC decreased quarter-to-quarter by 2.63%, while ETH rose 24%. There is a little hope and optimism towards the Crypto market with important events such as the Ethereum Merge in September 2022. However, the completion of The Merge did not have a significant impact on price movements. The worsening of macroeconomic features also affects the market movement which tends to stagnate.
The Fed also still raises the benchmark interest rate following inflation data that does not go down. The following section will explain several major events in the third quarter.
Rollercoaster for the Crypto Market
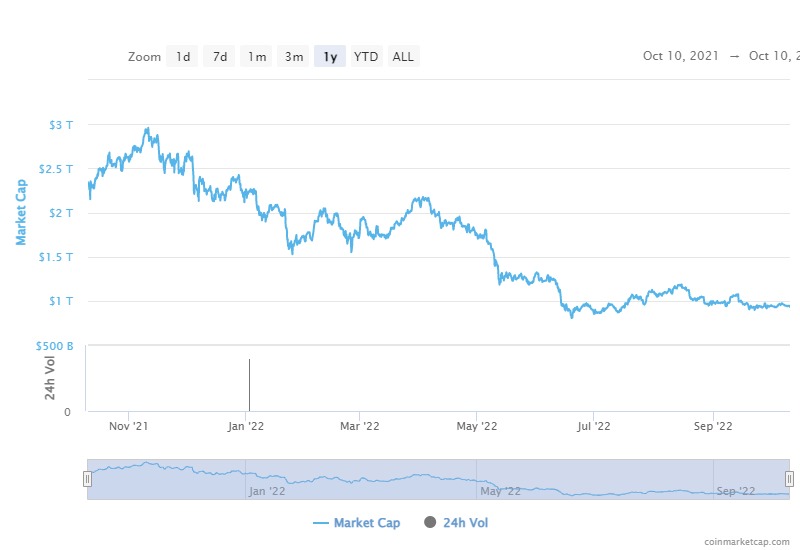
Referencing data from Coinmarketcap, at the beginning of Q3 2022, the Crypto Market capitalization was in the range of $1.2 trillion US dollars, an increase from the range of $900 billion US dollars recorded at the end of Q2 2022. However, since mid -September 2022, the market capitalization returned down and moves to $1 trillion US dollars. The success of The Ethereum Merge apparently did not move prices in a positive direction.
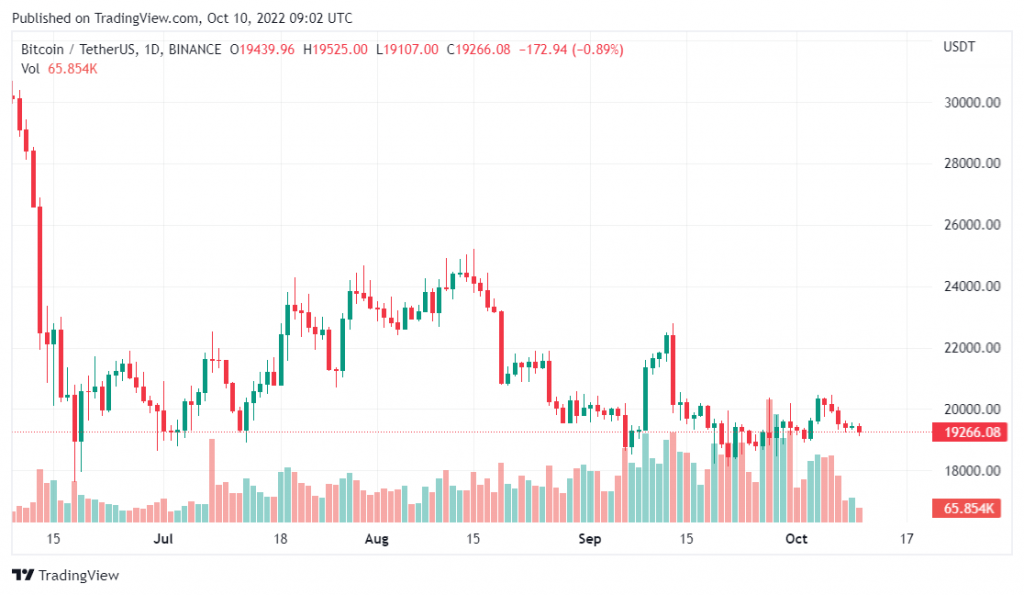
September is usually the worst month for Bitcoin. In the last five years, Bitcoin has always fallen in September. The graph above shows that in early September, BTC experienced a significant rally toward the price of $ 22.8K. However, the price then plunged to $20K the day after. The decline triggered a deeper correction until early October. After that BTC dropped several times to $18K. However, there is optimism because the price has not touched the June low which is at $17.6K.
In addition, some assets go against the trend and rallied in the third quarter. MATIC rallied from $0.42 in early July to reach $1 dollar on August 3. CHZ, the token from the Chiliz platform, also does a 300% rally in the third quarter. It sits at the $0.09 price in early July and reached $ 0.28 by September 23. Defi tokens UNI and LDO also increase by around 100% and 700% from July to August. However, both of them have been in a correction since the rally.
💡 CHZ, UNI, and MATIC rallied due to the announcement of partnerships with large corporations. Meanwhile, LDO rose because of the hype before The Merge.
US Dollars Strength Index, Inflation, and The Fed
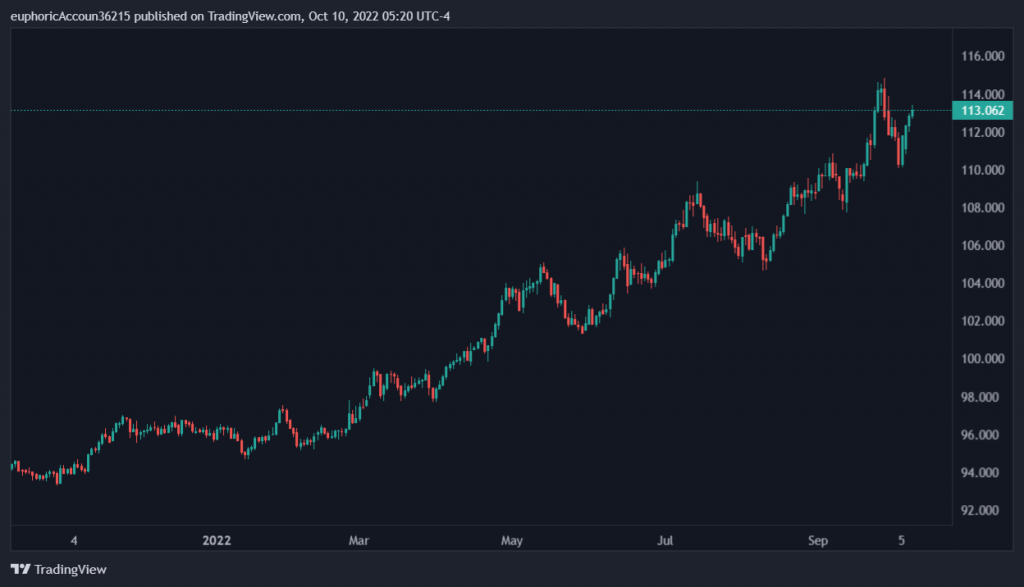
Inflation and fear of recession make global economic conditions full of uncertainty. Many analysts say that in 2022 “cash is king” which means they think the best asset this year will be fiat currency, especially the US dollar. This is justified by the graph of the strength of the US dollar (DXY) above. Since the beginning of 2022, DXY charts are experiencing an uptrend that is yet to slow down.
As we know, Bitcoin usually has an inversion correlation with DXY trends. The more the power of the dollar continues to rise, the BTC price movement is suppressed. DXY is likely to continue to increase seeing the Fed which is still being hawkish in monetary policy.
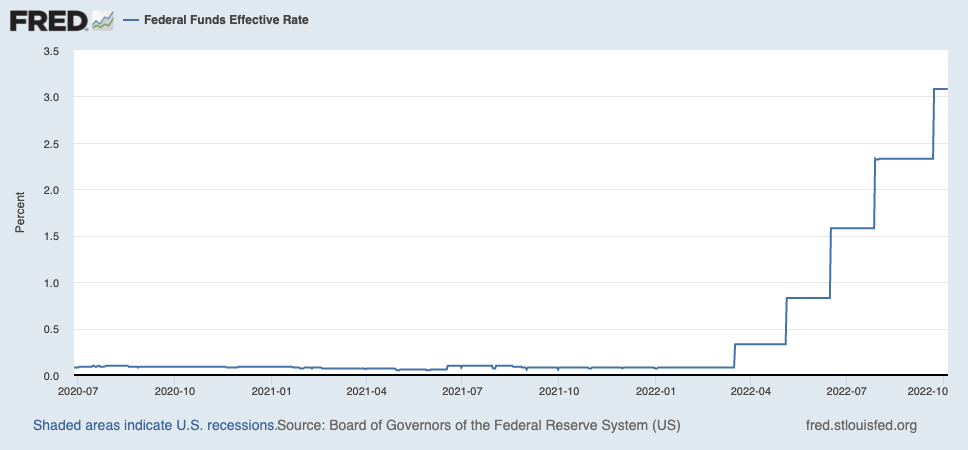
On September 21-22, the Fed (FOMC) meeting resulted in another 75 bps (0.75%) interest rate hike. This places the Fed’s benchmark interest rate at 3-3.25%. If we look at the BTC chart, it decreased before and after the FOMC meeting.
The Merge and Ethereum Prices
In July 2022, the price of ETH jumped 20% following the completion of the Merge trial on the Sepolian public test network. The Ethereum developer also said that the Mainnet Merge will be out on September 19. The market responded to this news positively. This is because the transition from ETH to Proof-of-Stake will reduce its energy consumption by 99% and is believed to further increase the adoption of cryptocurrency.
You can explore The Merge in the following article: What happened to Ethereum after The Merge?
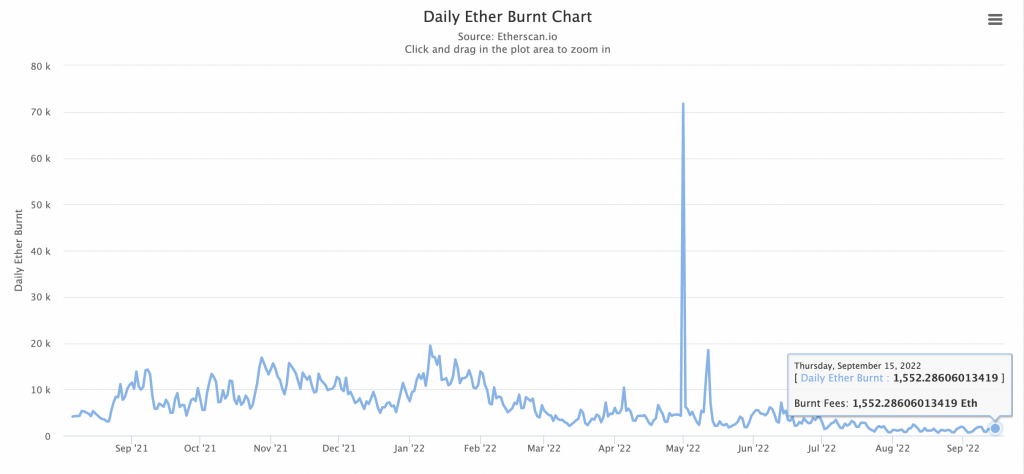
With the change from proof-of-work to proof-of-stake, Ether (ETH) issuance decrease significantly. The reduced ETH issuance was initially believed to make ETH a deflationary asset.
However, gas fee combustion turned out to be reduced along with the decline in the number of transactions on the Ethereum network in the middle of the bear market. This causes the ETH supply to continue to increase after The Merge. With the increasing supply of ETH in the current market, ETH has not become a deflationary asset.
Nearly a month after The Merge, the ETH price continues to decline. As of October 16, 2022, ETH was in the price range of $1,200 US dollars after reaching the highest number of $2,000 a month before The Merge.
You can also watch the video below to understand more about The Merge! 👇👇
Crypto Market Conditions Q3
The Layer-1 Competition
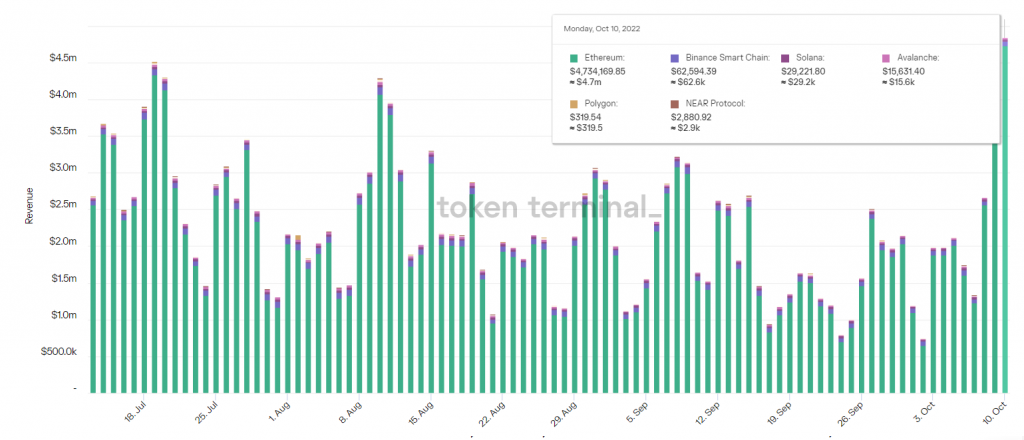
Along with the price of several Crypto Layer-1 that move sideways, the graph of revenue of a number of blockchain networks also tends to be sideways in the third quarter. However, there were a few days when the income declined and increased dramatically. Ethereum, Binance, Solana, and Avalanche are still leading in the amount of revenue owned by the blockchain. In fact, Ethereum always gets a minimum revenue of $1 million US dollars during the third quarter.
One of the surprising things is Polygon, which has steadily decreased income since September. Polygon revenue in the last 30 days decreased by -57.48%, with a few days where Polygon has 0 revenue. This is the opposite of the Near Protocol which has increased income by +82.54% in the last 30 days.
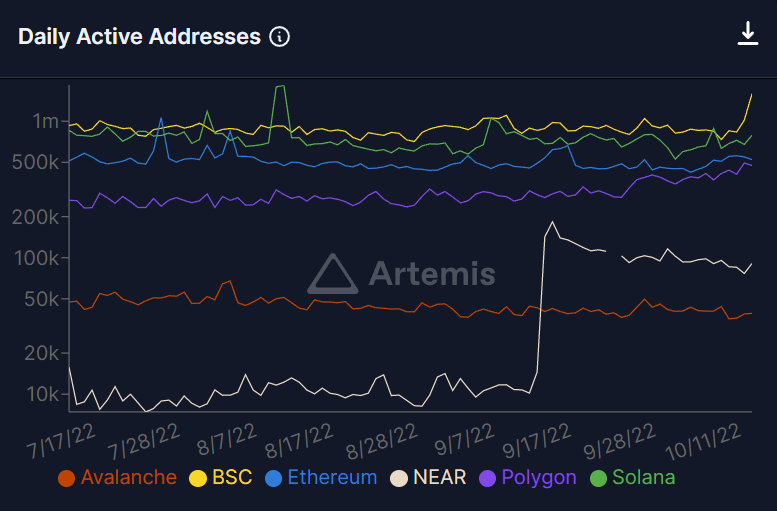
In the context of the active users (measured by daily active address), the majority of Blockchain Layer-1 has a steady amount of active users. In the picture above, we can see something interesting when comparing market capitalization and the number of active users. Ethereum has a 4 times bigger market capitalization than BSC and 14 times greater than Solana. However, active users of Solana and Binance are greater than Ethereum. Binance even touched 1 million active users several times throughout quarter 3. This places Binance as the largest blockchain network in daily active users.
In addition, the Near Protocol has increased dramatically due to the launch of the Sweat Economy application, a M2E (Move-to-Earn) protocol like STEPN.
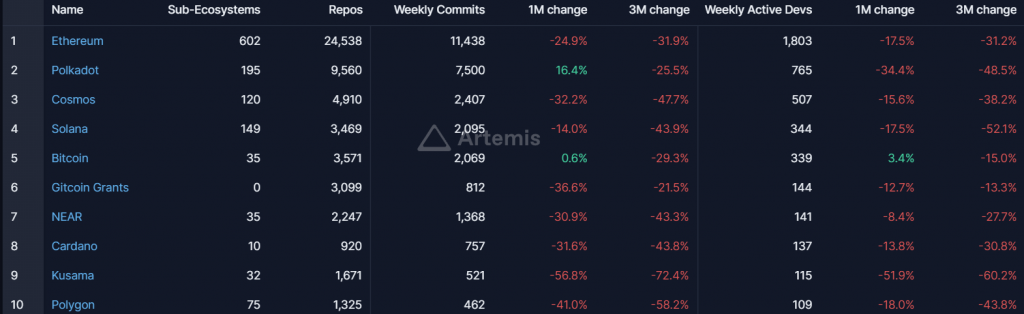
The picture above is a table of developers’ activity from several Blockchain Layer-1. Commits are the smallest measuring unit carried out by the developer. The table above measures how many active developers are from a network and also how many Commits they do. Measuring developers’ activity is helpful for analyzing blockchain with the most active developers even in poor market conditions.
The DeFi Industry Struggles to Recover
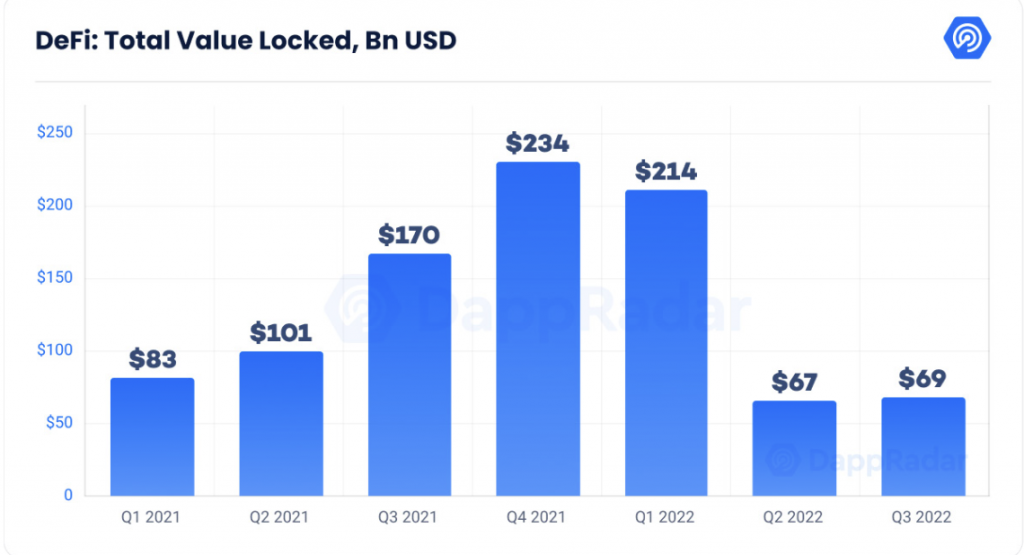
As in the picture above, the DeFi industry experiences a slight recovery after falling in the second quarter of 2022 (due to terra). Ethereum still leads the Defi market with TVL worth $ 31.16 billion US dollars and market dominance of 57%. Furthermore, Tron and Binance Chain followed with $ 5.57 and $ 5.36 billion US dollars respectively. The DeFi industry is still trying to recover the trust of users after the Terra and Celcius collapse.
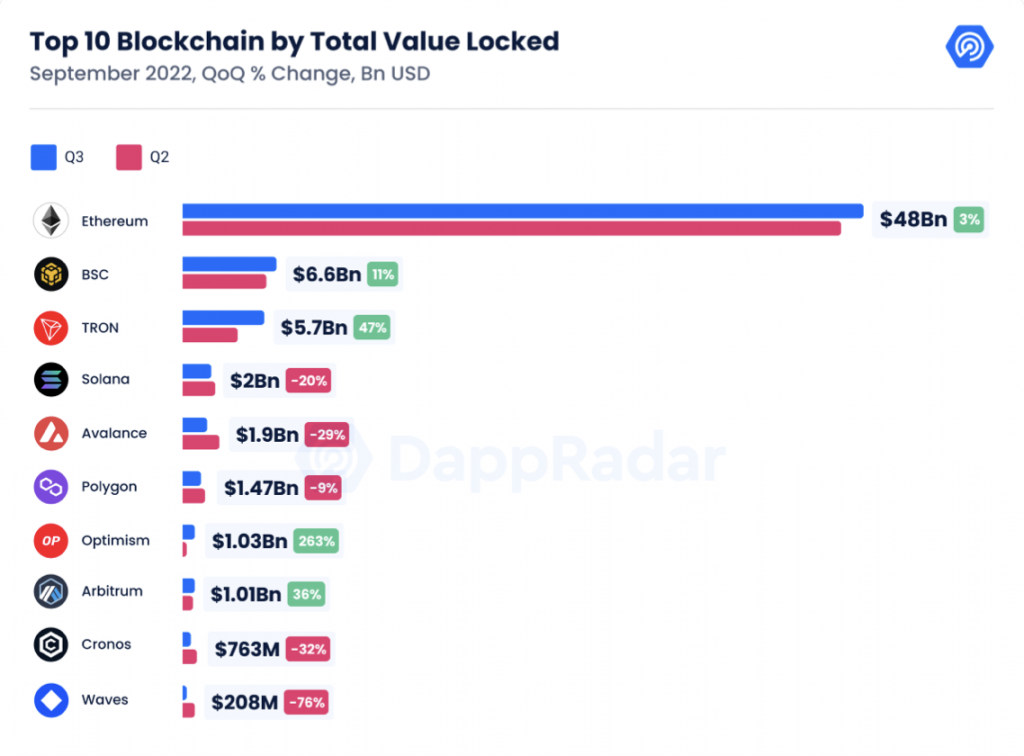
In TVL growth per blockchain, Tron has the greatest growth among other blockchains. This growth is likely because the user of the Tron DeFi application began to return after the terra event. The DeFi sector in Tron is dominated by JustLend, a loan application specific to the Tron Ecosystem.
In addition, the picture above shows that Optimism and Arbitrum, a Layer-2 scaling network in Ethereum, successfully reach a TVL of $1 billion US dollars. This is caused by various popular DeFi applications such as Aave, GMX, and Uniswap starting to support the two Layer-2.
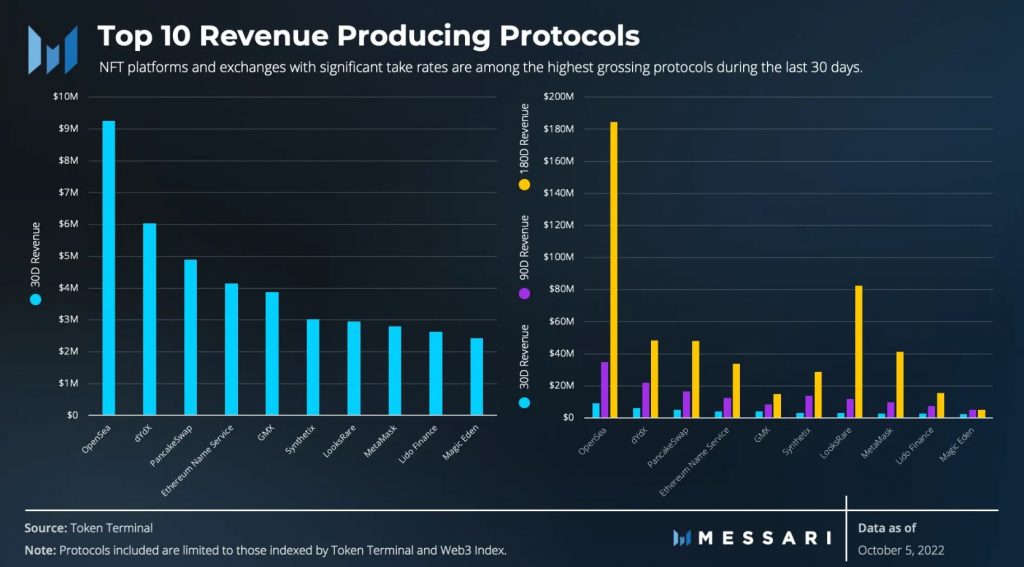
The picture above shows 10 crypto platforms with the largest income. Similar to the previous quarter, OpenSea took the lead in the highest income last month and in the last 6 months. dYdX and Pancakeswap lead behind it with Pancakeswap as the biggest DeFi application on Binance Chain. Finally, as seen in the graph on the right above, most DeFi platforms have reduced revenue figures in the last 30 days. This was triggered by the September poor market performance and the deteriorating global economic conditions.
However, measuring the income of each platform becomes an important metric in seeing the fundamental values of each platform. Platforms that can capture value from network activity have better sustainability, especially in a sustained bear market.
💡 Token Terminal distinguishes between fees taken from users and revenues obtained by each crypto platform and blockchain. Fees are the amount of money generated from the economic activity of the platform while revenue is the net income obtained by the platform and token holders.
Example: Uniswap gets a fee worth $42,4 million in the last 30 days but has 0 revenue.
GameFi and Crypto Gaming
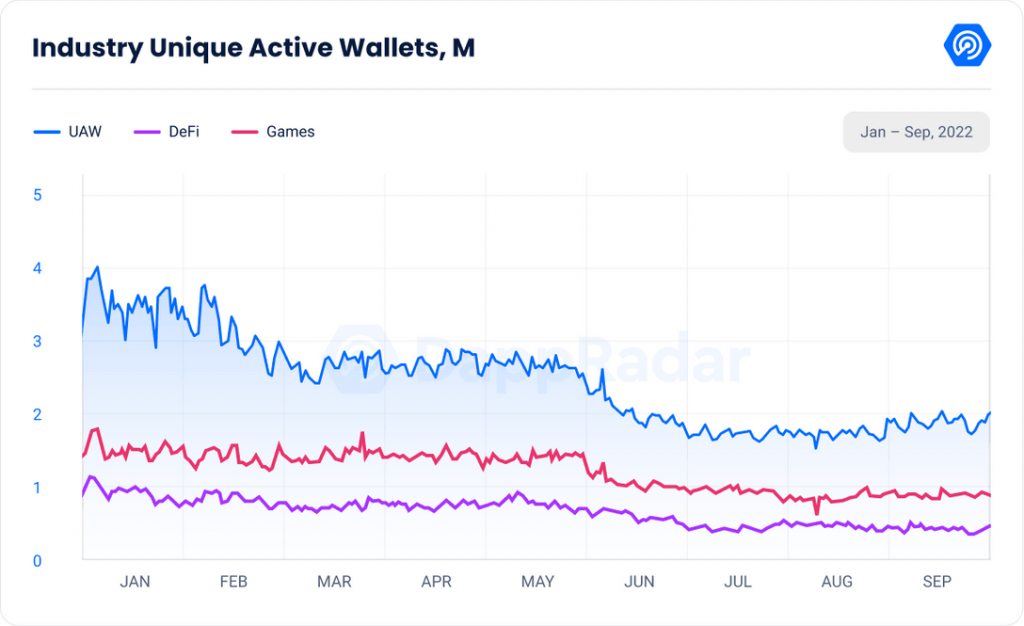
As in the picture above, the GameFi sector is also trying to recover from the initial decline in June. The active user number (red line) in the third quarter showed an increase of 8% to 912K users since early September. This figure represents 48% of the overall activity in the blockchain, a positive indicator of the contribution of the GameFi sector. From this 912K, Wax (338K), Binance Chain (114K), and Polygon (65K) are three blockchain networks that contribute the highest user number. However, the three of them experienced a fairly large decline (above -10%) except Binance with -2%.
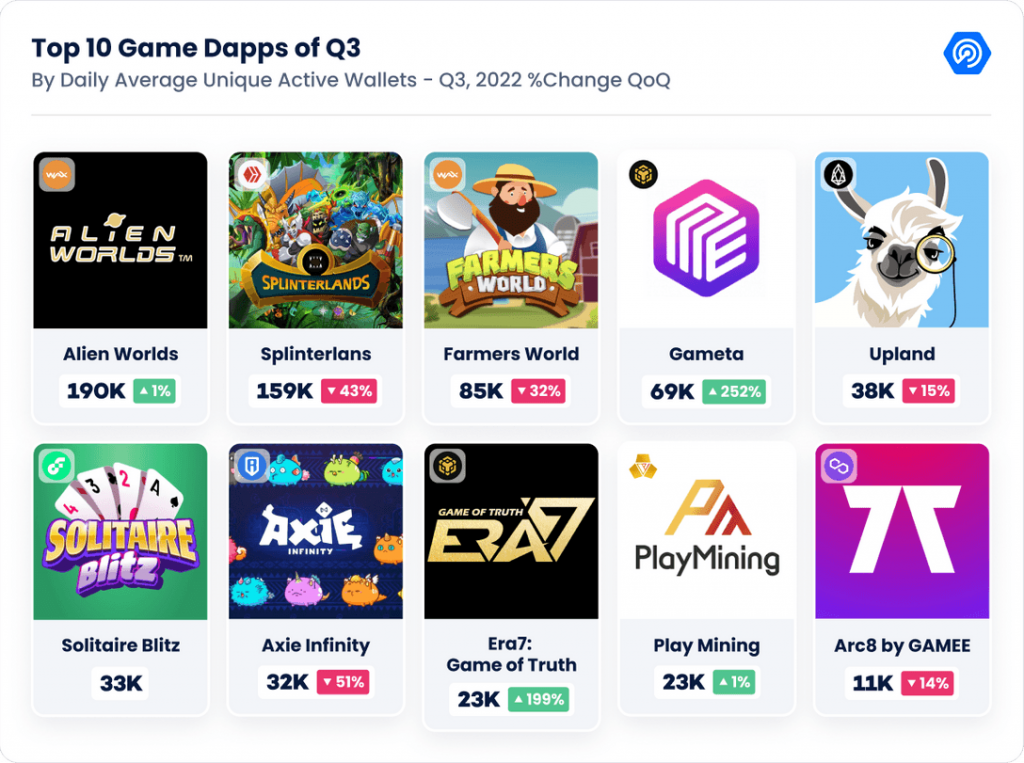
In the Crypto game rank with the most users, Alien Worlds returns to lead as the most played game. Alien Worlds is a crypto game that focuses on the NFT and light on the DeFi side. Players get financial benefits through staking features and selling NFT in the game.
Meanwhile, Gameta experienced a user increase of 252%. Gameta is a gaming web3 platform that has its own game ecosystem similar to Gala Games. At first, Gameta was built on Solana but now it has migrated to the Binance network. Currently, Gameta offers 7 games: Invest Master, Anits Runner, Super Gloves, Sleep Ragdoll, Frogprince Rush, Human Tower, and Tadpole Count. Gameta’s active user number rose 109% in September, making it one of the most popular decentralized applications, even rivaling PancakeSwap, a DeFi protocol in Binance.
💡 In addition, there is a significant movement in the M2E (Move-to-Earn) application sector such as STEPN. Some M2E applications began to emerge to rival Stepn. Some of them are Sweat Economy (Near), Step App (Step Protocol), and Olivex which has its own sports application ecosystem.
With a large number of GameFi projects and various sectors, this industry always has a new trend that can attract thousands of users. Starting from Axie Infinity which still releases new products, Otherside from Yuga Labs, to the new M2E application that provides many benefits. The GameFi industry is always interesting to consider and already has its own user base.
NFT
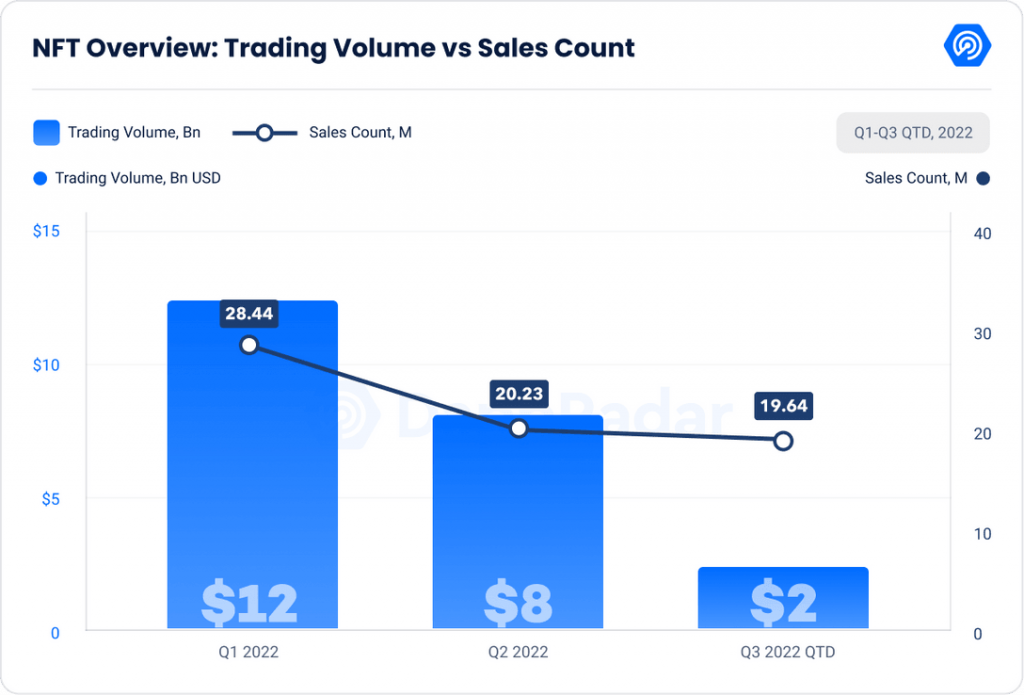
From the yearly chart above, you can see a drastic decrease in NFT trading volume (around 75%). This is likely to be the aftermath of the Crypto market bear market which “officially” begin in the second quarter. However, the number of transactions that occurred did not experience a large decline. The gap between the two data is because trade with high transaction value has decreased.
Demand for the NFT industry also continues the bear market trend from the end of Q2. Q3 gives a little stability, with the number of active users only reduced by 0.1 million from Q2 of 2.3 to 2.2 million users.

The decline in trade volume and the number of NFT sales is more obvious if we look at the graph for 2022. January is the peak of trade volume and the number of NFT transactions. As in the picture above, June is the lowest point in the NFT industry and is now trying to recover.
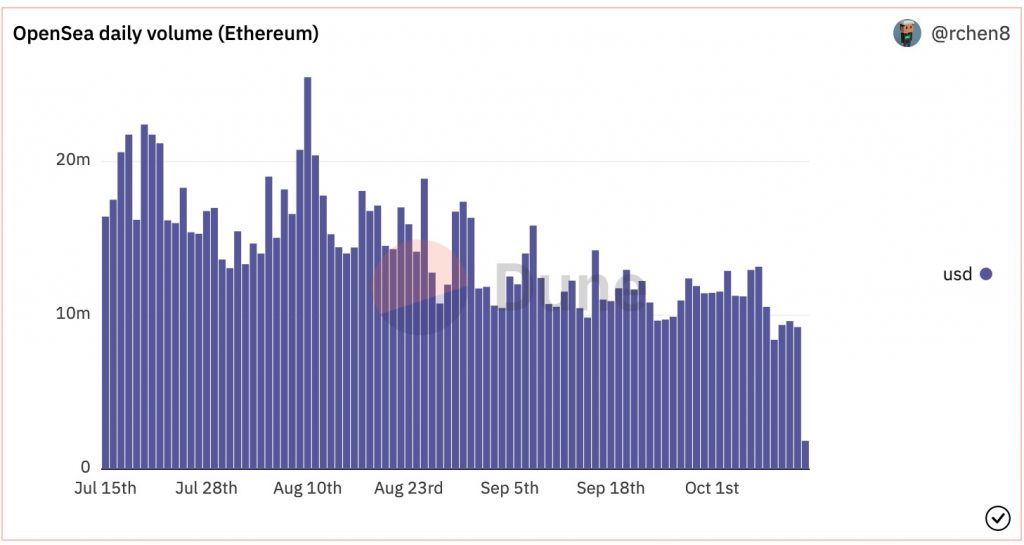
In the NFT trading chart on OpenSea, we can see a clear decrease in the volume of daily transactions in Q3. Even so, the biggest sales occurred in OpenSea where Cryptopunk #5822 was sold for 8,000 ETH (around $ 23.7 million dollars). This is why OpenSea dominates in NFT trading volume measures and not in the number of sales.
In the picture below, we can see that the number of NFT transactions is spread over various platforms. One of the interesting things is Immutable X is the only platform with an increase in trading volume since last quarter (+87%).
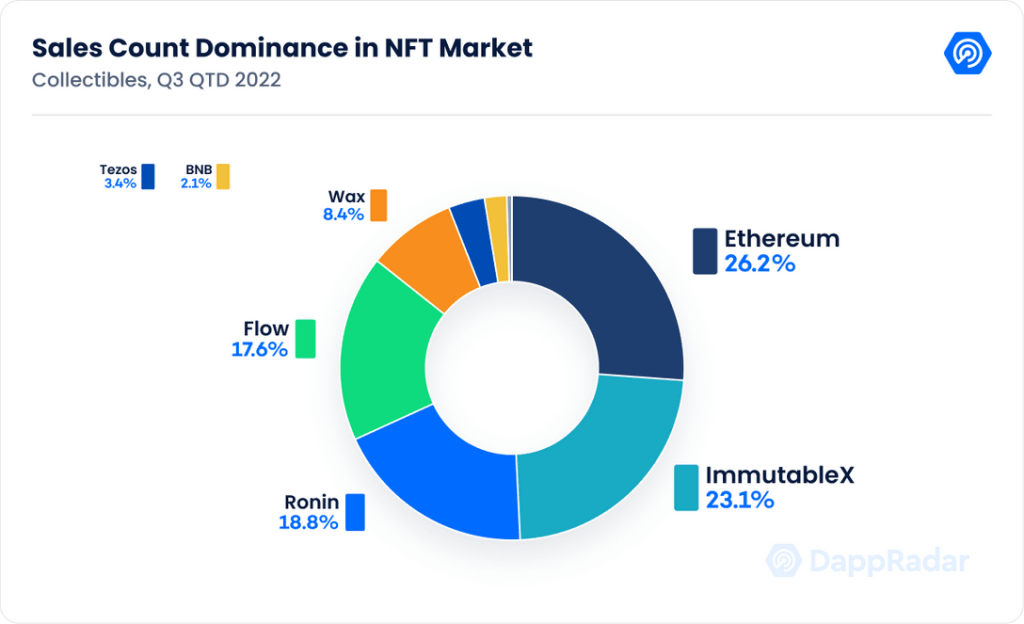
The NFT market is experiencing a slow recovery in the third quarter. Based on several existing metrics, demand for the NFT industry still exists. Companies like Starbucks began to offer NFT as a new experience for their users. Although the bear market trend encourages many NFT users to go, we can see that there is still a lot of life in this industry and it is far from the word “dead”.
What’s in the fourth quarter?
Uptober or Down?
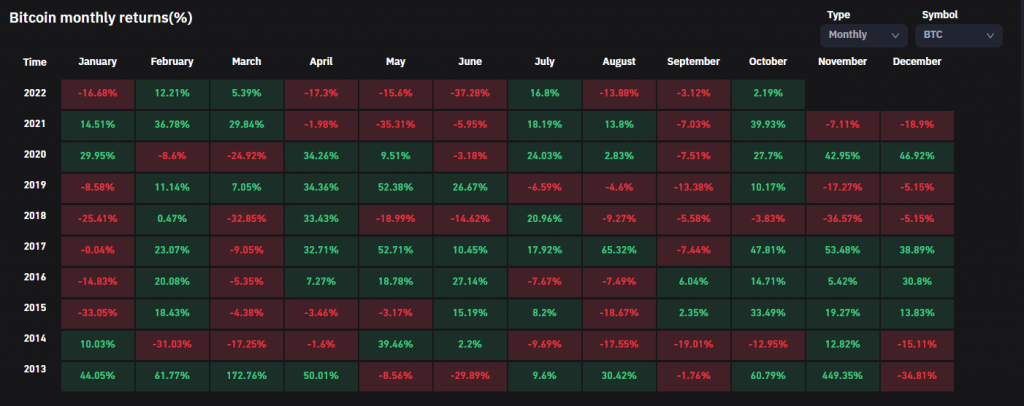
As shown in the picture above, October is usually a green month. BTC has had positive returns in October in the last three years. As of October 14, 2022, Bitcoin was in the price range of US $19,8k. BTC managed to rise after falling to the lowest number $18,2k after the release of US inflation data (CPI) which shows a higher number than predictions (0,1% more). With the deteriorating global economic conditions, the current increase in BTC will likely be short-lived.
Furthermore, in the last five years, BTC has decreased three times in the fourth quarter. In the 2018 Bear Market, BTC even decreased by -45.55%. The movement of Bitcoin in this quarter will also be influenced by the Fed policy and global economic conditions.
The Fed and Inflation
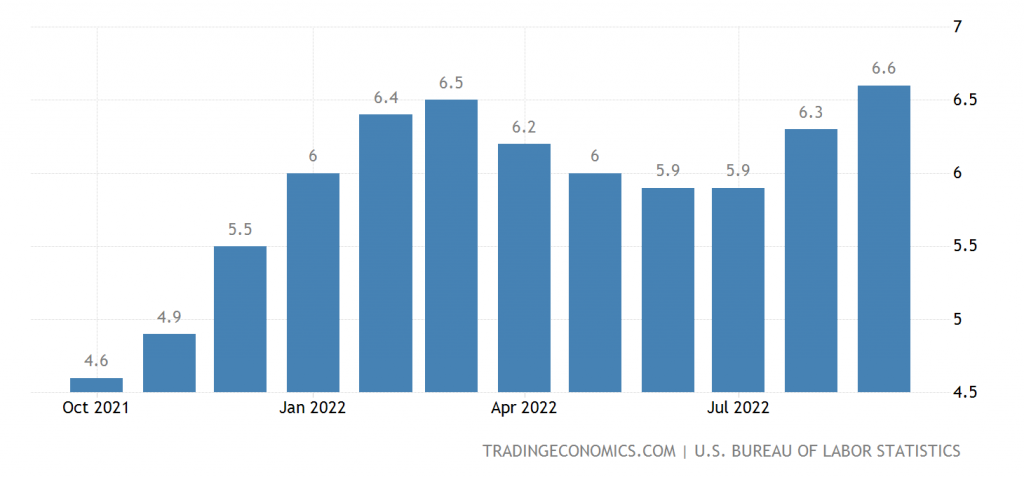
On October 13, 2022, the US CPI number is 8.2%, higher by 0.1% than predictions. However, a more significant number is core inflation which represents the price of all items except food and energy. As in the picture above, the US core inflation rate rose to 6.6%, the highest in the last 40 years. Seeing the high inflation rate, the possibility of the Fed to do a pivot (changes in policy direction) is tiny. The only way to fight inflation is to increase the fed’s benchmark interest rate.
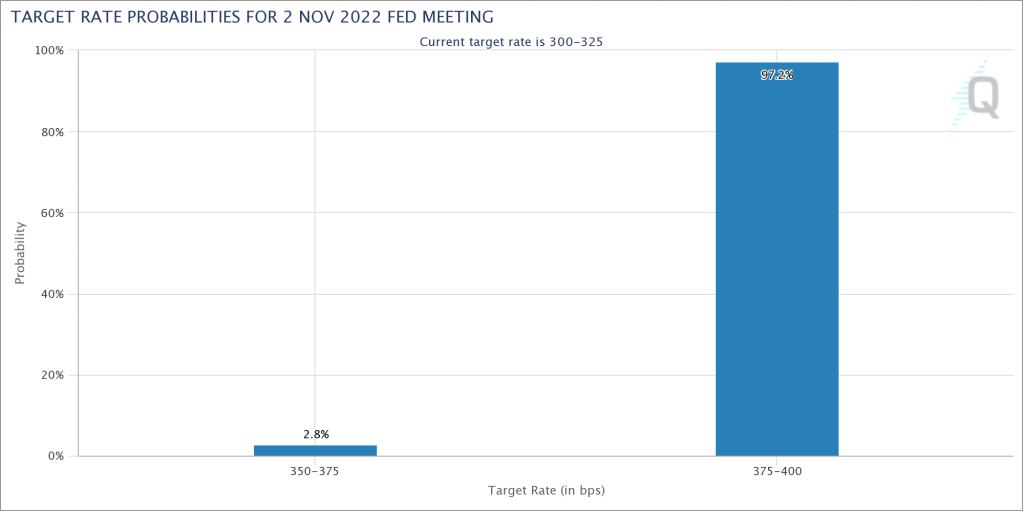
The picture above is the possibility of 75 bps and 100 bps rate hikes. At present, the probability of 75 bps is almost 100%. In addition, there are 2,8% possible interest rates of 50 bps but this is seen as impossible, seeing the high number of inflation.
💡 BPS or base points are measuring units for interest rates and several other things in the financial world. 1 BPS is equivalent to 0.01%. So, an increase of 75 bps means 0.75%.
Crypto project with important milestones in the fourth quarter
- 🌶️ Chiliz Chain 2: In the Chiliz Roadmap , Chiliz Chain 2 plans to be launched in Q3-Q4. However, seeing now that CC2 is still in the testnet, we can wait for further explanation from the Chiliz team about CC2 in Q4.
- ⚽ World Cup 2022: The FIFA world cup will be held from the end of November to December 2022. Two crypto projects that are likely to benefit from this competition are Chiliz and Algorand. Algorand has cooperation with FIFA for an NFT collection while Chiliz has cooperation with various stars and organizations such as the Argentine national team.
- 🤝 New cooperation of Polygon and zkEVM Technology: Seeing the two previous quarters, we can expect that Polygon will announce other major cooperation. In addition, we will get additional information about the zkEVM scaling technology that is being tested by Polygon.
- 🔗 Chainlink Staking: In December 2022, Staking Chainlink version 0.1 will be released to the public. Staking will provide a much-needed use case for LINK. This staking is also the first step of the revamped Chainlink economic system.
- ⚛️ Update about Interchain Security Cosmos: Cosmos has just issued an ATOM 2.0 whitepaper about changes in various aspects of the Cosmos ecosystem. The first update, Interchain Security will be launched in Q1 2023. However, this update is still a draft that has not been approved. Q4 will provide clarity about the future of Cosmos.
How to Buy Cryptocurrencies at Pintu
You can start investing in cryptocurrencies by buying them in the Pintu app. Here’s how to buy crypto on the Pintu application:
- Create a Pintu account and follow the process of verifying your identity to start trading.
- On the homepage, click the deposit button and top up the Pintu balance using your preferred payment method.
- Go to the market page and look for your favorite crypto assets.
- Click buy and fill in the amount you want.
- Now you have crypto as an asset!
In addition, the Pintu application is compatible with various popular digital wallets such as Metamask to facilitate your transactions. Go and download the Pintu cryptocurrency app on Play Store and App Store! Pintu is regulated and supervised by CoFTRA and Kominfo.
You can also learn more crypto through the various Door Academy articles which are updated every week! All Pintu Academy articles are for educational purposes, not financial advice.
References
- Tom Dunleavy and Kunal Goel, State of Ethereum Q3 2022, Messari, accessed on 11 October 2022.
- Clarissa Watson and Francesco Andreoli, The Merge Is Done. What’s Next for the Ethereum Ecosystem?, ConsenSys, accessed on 11 October 2022.
- Dustin Teander, The Bear Necessities: 7 Trends and Theses Part 2, Messari, accessed on 12 October 2022.
- GokuStats by Artemis, accessed on 12 October 2022.
- Chase Devens, Analyzing Leading Protocol Fundamentals, Messari, accessed on 12 October 2022.
- DappRadar, DappRadar Q3 Industry Report – On-chain indicators signal a recovering crypto market, DappRadar, accessed on 13 October 2022.
- Sara Gherghelas, DappRadar x BGA Games Report – Q3 2022, DappRadar, accessed on 13 October 2022.
- Sara Gherghelas, NFT financials falling in Q3 but on-chain metrics remain bullish, DappRadar, accessed on 14 October 2022.
- Rchen8, OpenSea, Dune Analytics, accessed on 14 October 2022.
- Jack Inabinet, 5 Things That Break With Rising Rates – by Jack Inabinet, Bankless, accessed on 14 October 2022.
Share
Related Article


See Assets in This Article
BTC Price (24 Hours)
Market Capitalization
-
Global Volume (24 Hours)
-
Circulating Supply
-