Market Analysis 17-23 July: FOMC Meeting and BTC Moving Sideways

Bitcoin started giving positive signals over the past week and managed to rise as much as 7%. Even so, news about the Fed’s rate hike still provides uncertainty. The Pintu Trader team has collected various important data about the price movements of the crypto market over the past week. In this Market Analysis, you can study the price movements of Bitcoin and other crypto assets, as well as find out the latest updates in the industry. All information from the market analysis is for educational and informational purposes, not financial advice.
block-heading joli-heading" id="market-analysis-summary">Market Analysis Summary
- 🏦 The Fed is expected to raise interest rates by 75bps (0.75%) on the 27th of this month. In addition, with quantitative tightening (QT) continuing the hawkish sentiment, the Fed will continue to reduce its balance sheet.
- ⚖️ BTC is likely to remain in the current price range for quite a while unless it breaks through the resistance or falls from the support.
- 🔍 Two BTC price indicators to watch out for are the 55-day MA and the 200-week MA. BTC needs to break these two resistance points to be able to reverse the downside momentum.
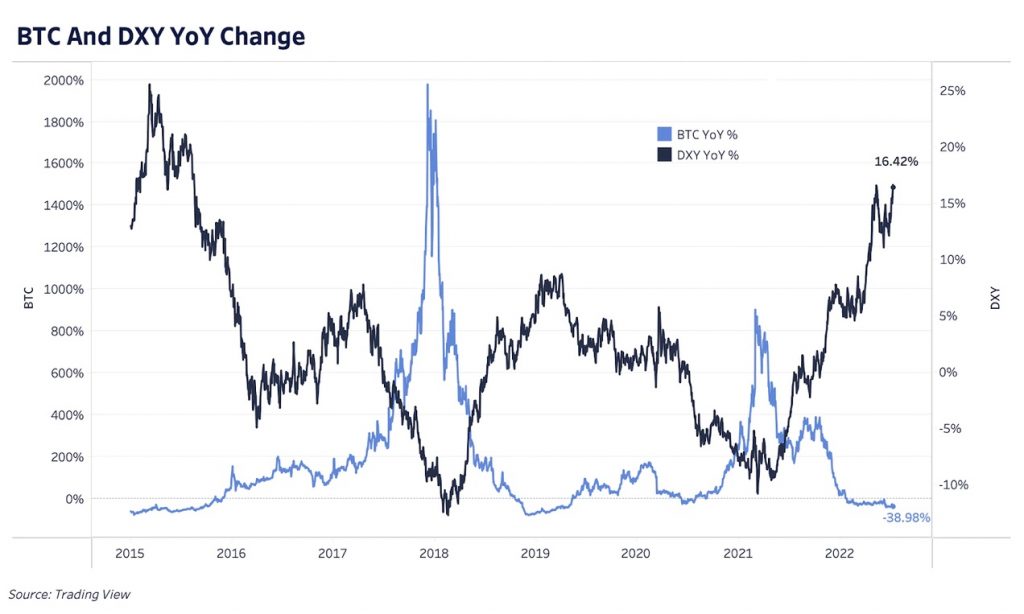
- 💵 The dollar index (DXY) chart shows that there will be a further increase following the FOMC rate hike that will occur at the end of this month. The analysis shows that BTC has an inverse correlation with the DXY trend.
BTC Price Movement 17-23 July 2022
The Fed’s interest rate is now in the 1.50%-1.75% range, and the 12-month federal funds futures have jumped to 3.44% in anticipation of additional rate hikes to come. Treasury bond yields also increased. In addition, the six-month Treasury bill now has a yield of 3.04%, and the three-year Treasury note at 2.51%.
The biggest reason for the recent rise in the US dollar is that the Fed has been more hawkish than the European Central Bank since the start of the year. The euro alone has fallen more than 13% against the USD year-on-year. The Fed is expected to raise interest rates by 75bps (0.75%) on the 27th of this month. The ECB said it would only raise interest rates by 25bps (0.25%). In addition, the Yen is also down 20% YoY against the USD, with their government continuing its easy money policy.
💡 What are hawkish and dovish?
Hawkish and dovish are two terms that refer to the government’s monetary policy sentiment. Hawkish sentiment tends to focus on controlling inflation as a monetary policy. Meanwhile, dovish focus on policies that promote economic growth and employment.
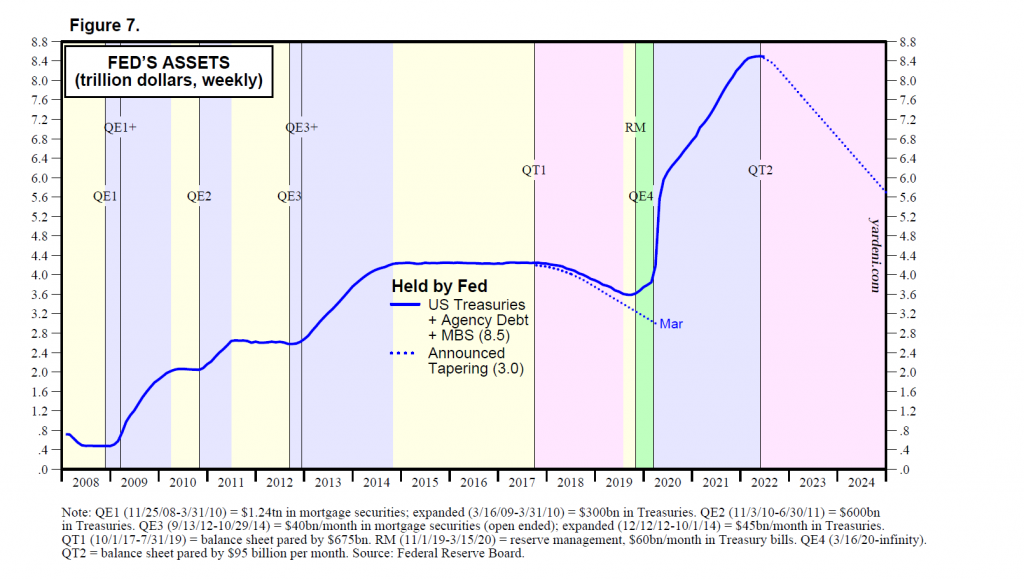
With quantitative tightening (QT) continuing the hawkish sentiment, the Fed will continue to reduce its balance sheet. Starting June 1, the Fed began releasing approximately 47.5 billion securities, 30 billion Treasuries, and approximately 17.5 billion mortgage-backed securities per month. However, in September this figure will raise to a total of $95 billion dollars per month. This number is double that of QT 2017–19. The Fed estimates that the value of QT in one year is roughly equivalent to a 25bps rate hike.
Over the week, we can see BTC rise from $20,500 to $23,000 US dollars. Bitcoin looks like it’s about to break through the resistance of the current price range and go up but this seems to be a false signal and it’s back down again. So, BTC is likely to stay within its current price range for quite a while, unless it manages to break through resistance or fall from support. As discussed earlier last week, market fluctuations are very risky to trade. A better strategy is to do DCA (dollar cost averaging) because trading in this market situation is similar to a coin toss, with a higher risk of getting burned.
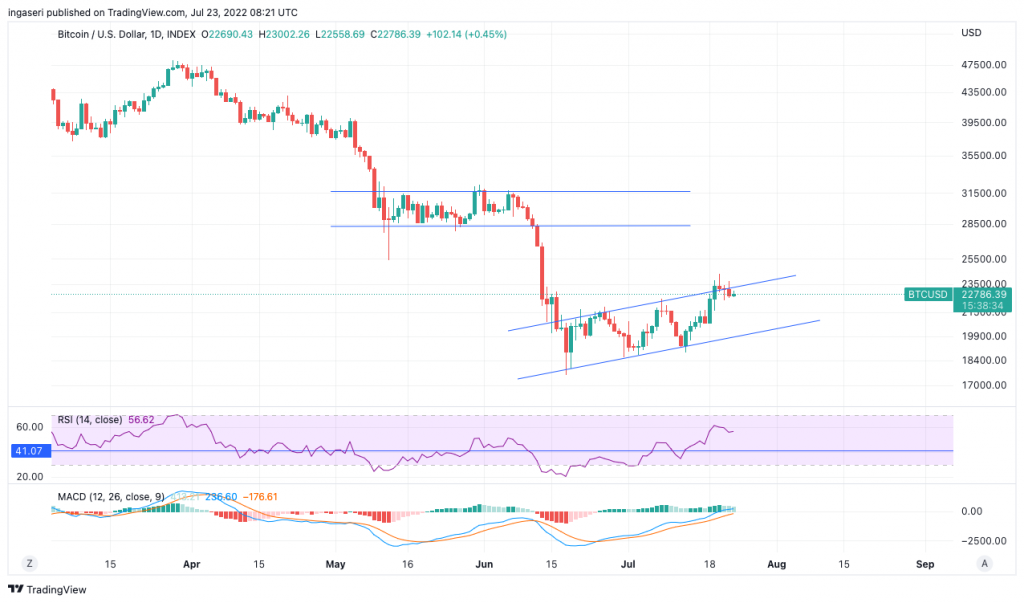
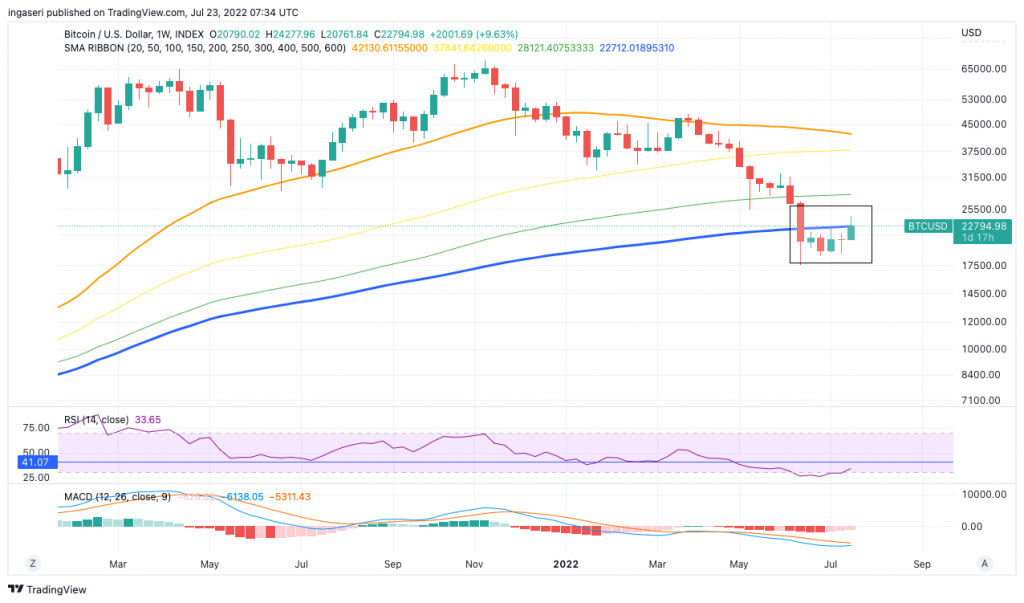
Notice in the chart below, when we are below the 55-day MA line, BTC often moves sideways. If BTC breaks this resistance line ($22,763 dollars), we will see a possible reversal of the downside momentum in the short term.
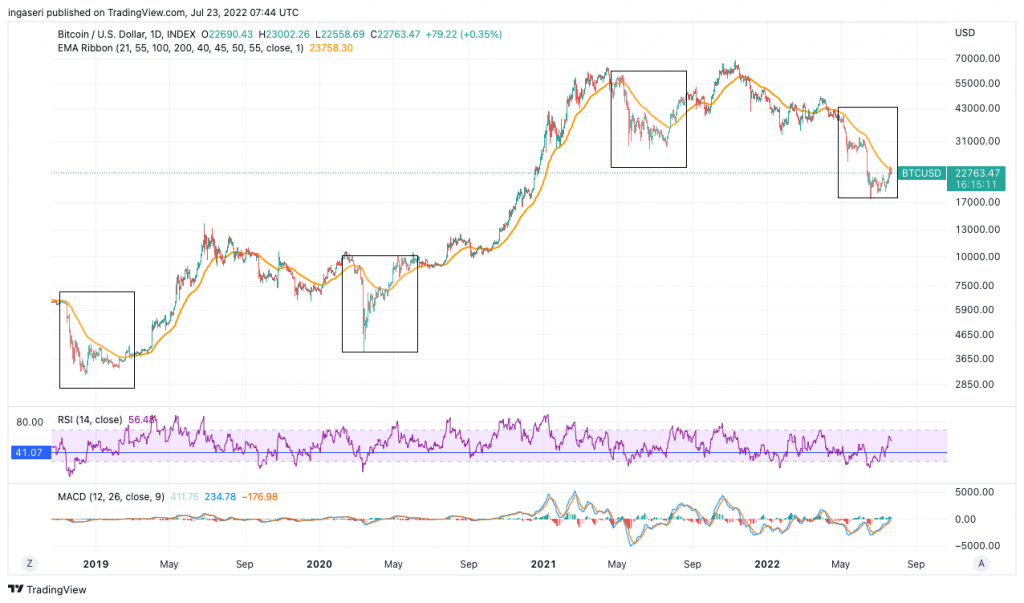
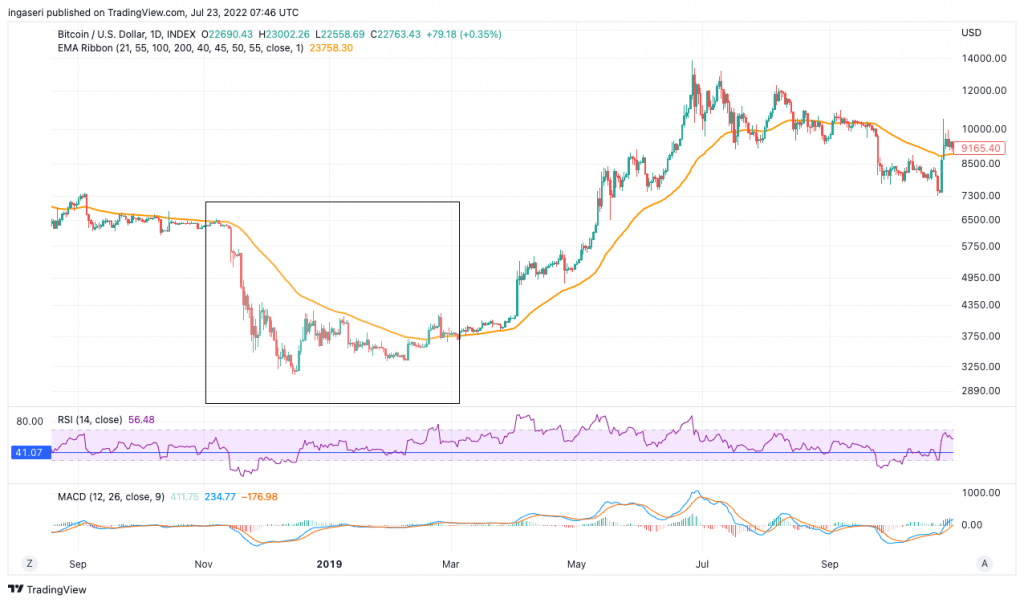
In 2019, we can see that even after crossing the resistance line, BTC experienced several weeks of sideways movement before shooting upwards.
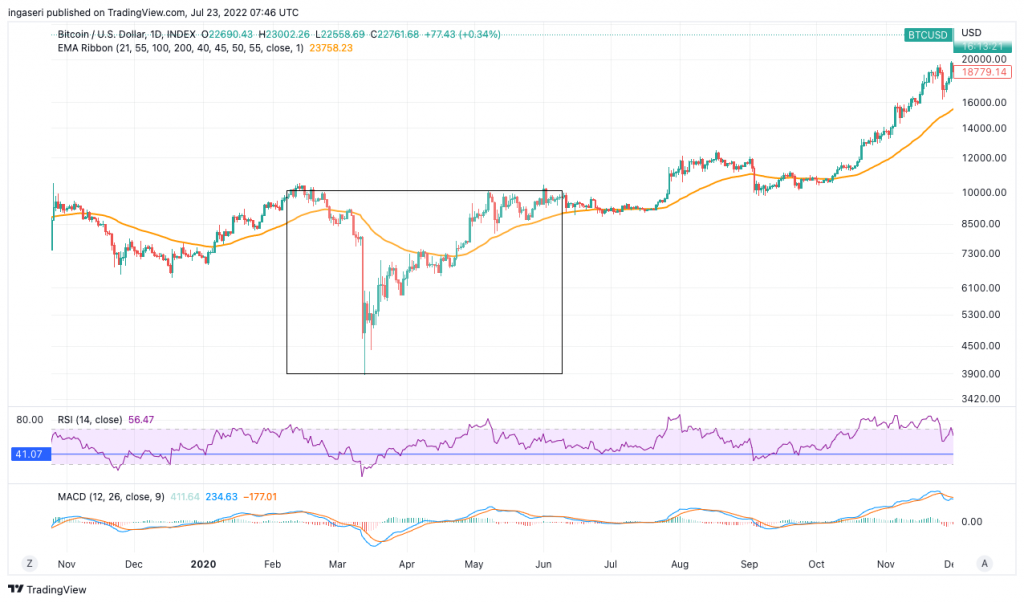
In 2020, we can see a big change in the trend after breaking this resistance. Just like before, the market moved sideways before finally rising.
On the weekly chart, we can see that BTC is still below the 200-week MA. If we manage to break through this resistance point, it will be an important signal for BTC.
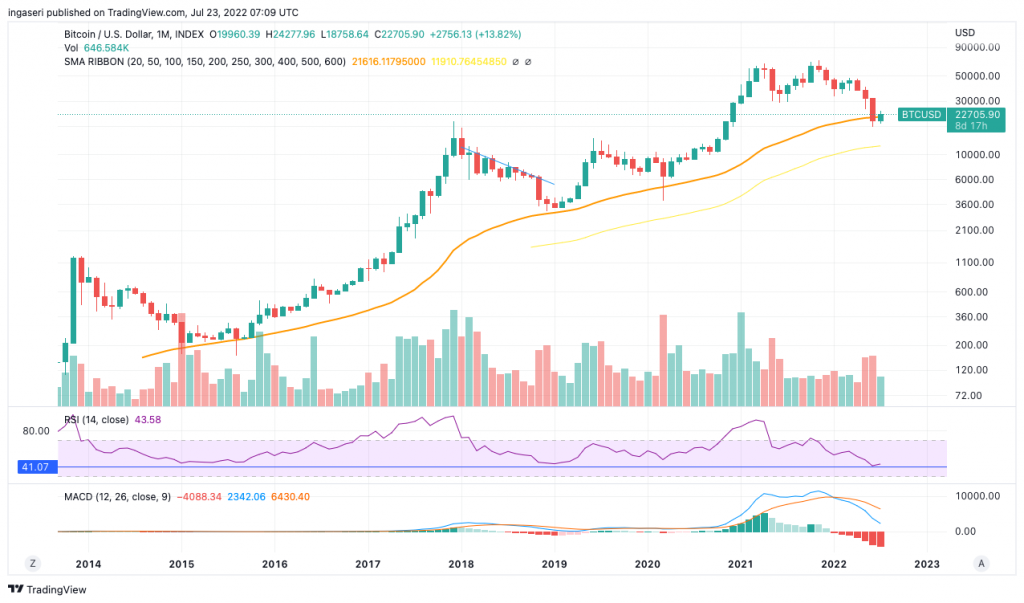
In the monthly chart, we can see that BTC is above the 50-month MA line. This point has historically been an accurate indicator for predicting market bottoms and turning points for bear markets. Therefore, we need to watch the price at the end of July because BTC never closes below this support line.
Read more: 4 crypto trading indicators
DXY, the dollar index found support in the 21-week EMA. Most likely we will see further gains in the DXY given that the FOMC rate hike will occur at the end of this month. So, the long-term trend is still up.
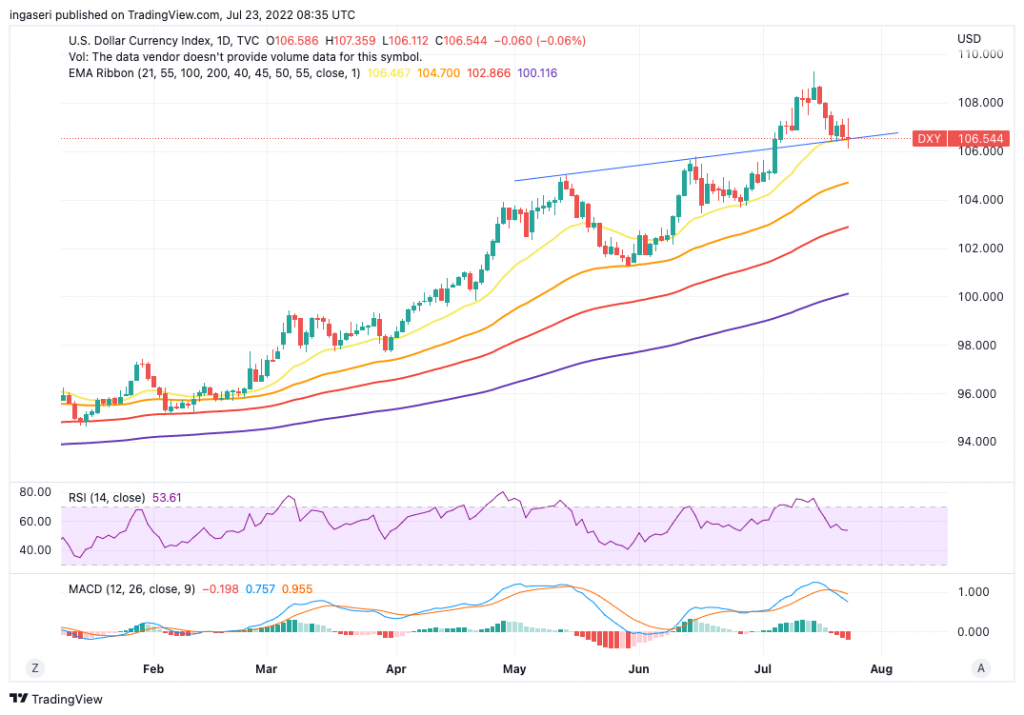
Notice the correlation between the YoY BTC and DXY price, there is a clear inverse correlation between the two. Unless we see a peak in inflation occur, with the Fed starting to reverse QT (Quantitative Tightening), the sideways market will continue.
On-Chain Analysis
📊 Exchange: On a weekly basis, the reserves of most exchanges remain the same, indicating no particular buying or selling pressure. Net deposits on the exchange are low compared to the 7-day average. This can indicate lower selling pressure.
⛏️ Miners: Miners sell holdings in a moderate range compared to their one-year average. Miners’ income has decreased significantly compared to the costs they need to pay. This can indicate that the price is undervalued as the miners’ motives to hold their assets increase.
🌐 On-Chain: More investors selling at a loss. It can show the bottom line of the market in the middle of a bear market. The movement of long-term holders in the last 7 days is lower than average. They have a motive to hold their assets. Investors are in a fear phase where they currently have slightly more unrealized gains than losses.
🏦 Derivatives Market: Short traders are still dominant and willing to pay long traders. Buying sentiment is dominant in the derivatives market. When OI (open interest) increases, it indicates more liquidity, volatility, and attention is coming into the derivatives market. The upward trend in OI can support the ongoing price trend.
News From the Altcoins World
- 💻 Polygon announces zkEVM: Polygon has just announced the creation of a new scalability solution that leverages zero knowledge cryptographic methods. The zkEVM (zero knowledge Ethereum Virtual Machine) technology can cut Ethereum transaction fees at Polygon to a lower level than they are now. Polygon announced that it will test this technology in the next months and launch it on the mainnet in early 2023.
- 🥲 A $150,000 joke: An NFT collector under the pseudonym Franklin (owns 57 BAYC) has just lost 100 ETH (worth $150,000 dollars). This happened because of a “joke” bid he made to his own ENS domain which was already sold to other people. The Ethereum Name Service is a tool for converting the alphanumeric sequences in digital wallets to letters. Franklin forgot to withdraw the offer he made and lost 100 ETH in an instant.
- 🪙 Curve plans a stablecoin: Curve Finance, one of the biggest AMM applications, is planning its own version of a stablecoin. Several reports citing the Curve team’s tweet explain that this stablecoin will be overcollateralized similar to Maker’s DAI. There is no further information about when this will be launched.
Other Important News From The Crypto World
- 📉 236.237 BTC sold since May: Vetle Lunde, an analyst with Arcane Research, released a report explaining that a total of 236.237 BTC were sold since May 2022. He added that the majority of these sales came from large institutions triggered by the Do Kwon and LUNA-UST incident. This Bitcoin sale is equivalent to $5.4 billion US dollars.
- 🌐 Ethereum new roadmap: Vitalik Buterin, co-creator of Ethereum, explains that Ethereum is only 40% complete and still has a long way to go after “The Merge” is planned for completion in September. Vitalik describes the following stages as “surge,” “verge,” “purge,” and “splurge.”
- 🕵️ CoinBase manager arrested: Ishan Wahi, former product manager of Coinbase, was arrested on charges of insider trading on Thursday, 21 July. Together with his friend Sameer Ramani, Ishan made a profit of $1.5 million dollars from 25 different crypto assets. Ishan leaked a list of crypto assets to his friends before the assets were listed on CoinBase to buy them cheaply. This is the first inside trading case in the crypto industry.
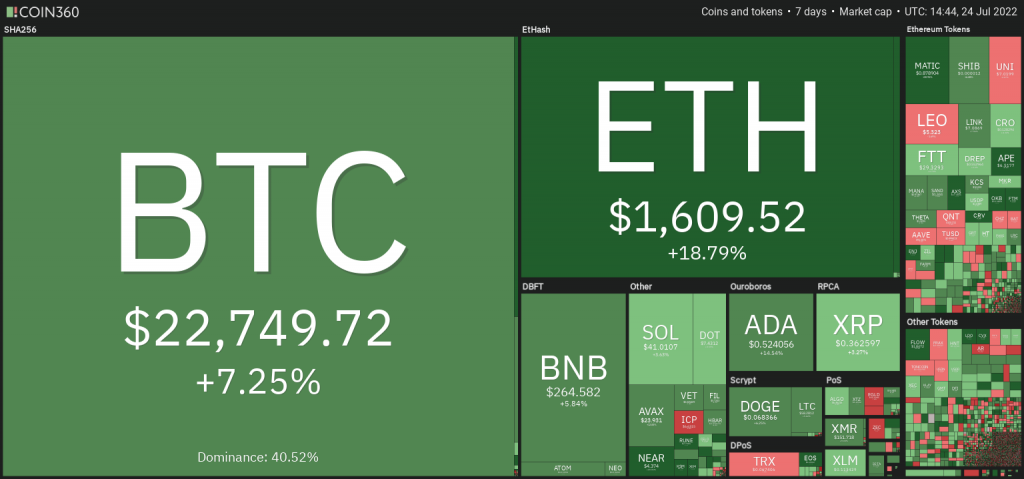
Cryptocurrency Performance Over The Past Week
References
- Andrew Asmakov, Polygon Launches New Scaling Solution to Further Cut Costs on Ethereum, Decrypt, accessed on 25 July 2022.
- Andrew Hayward, Ethereum NFT Whale Loses $150K on a Meme Gone Wrong, Decrypt, accessed on 25 July 2022.
- Owen Fernau, Curve Finance Has a Stablecoin in the Works, Defiant, accessed on 25 July 2022.
- Brian Newar, Large institutions sold $5.5B in BTC since May — and we’re still here, Coin Telegraph, accessed on 25 July 2022.
- Kate Irwin, Ethereum Merge? Get Ready for the ‘Surge, Verge, Purge, and Splurge’, Says Vitalik Buterin, Decrypt, accessed on 25 July 2022.
- Catarina Moura, Former Coinbase product manager arrested on insider trading charges, The Block, accessed on 25 July 2022.
Share