Market Insights Feb 20-26: Russia Invades Ukraine, BTC Moving Sideways

Bitcoin (BTC) Price Movement
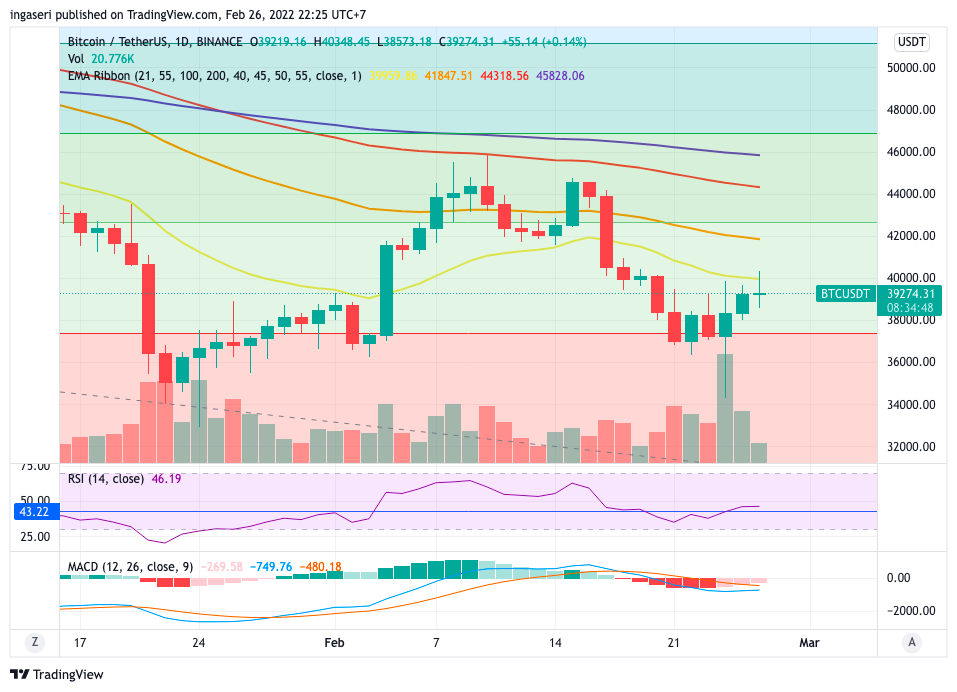
Over the past week, we have seen the volatility of BTC due to Russia’s invasion of Ukraine. The price of BTC, which is considered a risky investment, took a hit when Russia began a large-scale attack on Ukraine. On the day of the invasion, BTC fell to US$34,000 before market participants reversed the situation, and BTC was then trading in the US$39,000 range.
The last candle as in the chart below shows that BTC was rejected at the 21-days EMA resistance line (US$40K). Market sentiment is still cautious, and most are still in wait-and-see mode. However, capitulation, or a situation where market participants give up and sell BTC massively, has not yet occurred. Most market participants still hope that the price will reverse up, so this means the price has not reached its lowest point. We must prepare for the possibility of capitulation.
If we refer to the weekly chart, BTC is still moving sideways between the 55-day and 100-day EMA. The RSI (Relative Strength Index) is still quite low, at the edge of 43. What is different now compared to previous periods is that there has never been an incident similar to the Russian invasion of Ukraine since the beginning of the massive adoption of crypto. So, the effects of this invasion are still unpredictable for the relatively new crypto market.
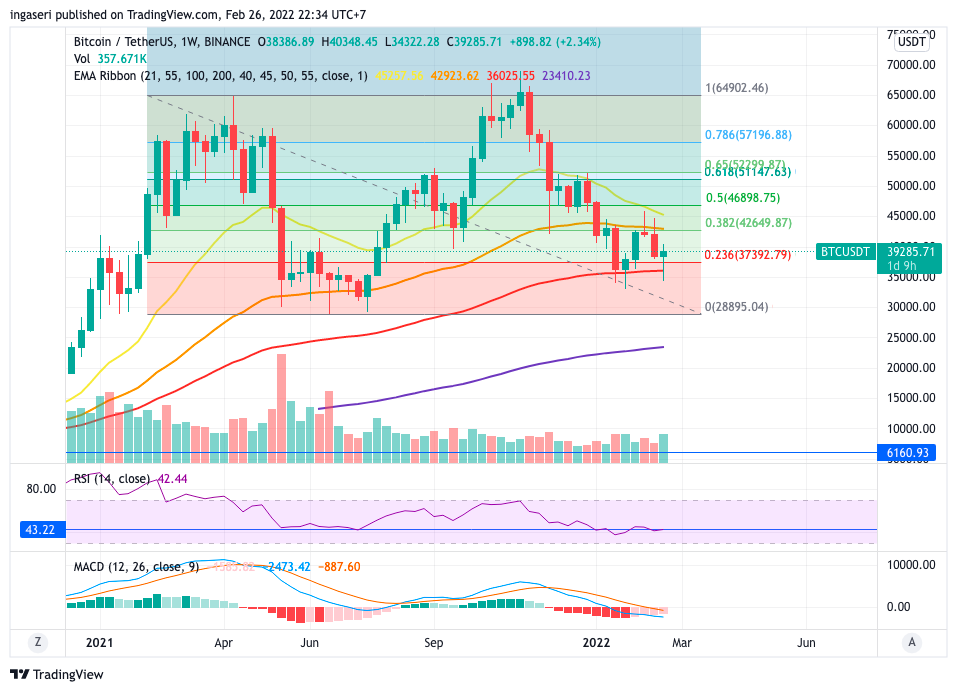
💡 The Relative Strength Index (RSI) is an indicator that shows price momentum. It works like a pendulum swinging from side to side using a 0-100 number measurement. A number of 0-30 indicates an oversold momentum, which means an asset has reached the maximum point of price decline and it will experience a trend reversal. On the other hand, the number 70-100 indicates an overbought momentum, which means that the asset price has reached the maximum point of a price increase and will experience a correction as a reversal trend.
Read also: 4 Crypto Trading Indicators You Should Know
What else is there to watch from the market?
- 💰 Gold prices soared: During a war, gold tends to outperform other markets. This was due to heavy spending by governments during wartime, a weakening currency, and the market tends to avoid riskier assets in favor of the safer gold. On the day Russia began the attack and launched missiles at Ukraine, the price of gold soared to the $1,900 range.
- 📈 Oil prices have also increased: Oil prices have also increased rapidly, even more so than gold, at one point reaching over US$100 per barrel. This price increase is because Russia is the third-largest oil producer in the world, producing almost 10% of the world’s oil and about 35% of oil for Europe. The sanctions imposed by countries against Russia disrupted the world’s oil supply and the accompanying payment system. With supply disrupted and demand remaining the same, oil prices are on the rise.
block-heading joli-heading" id="conclusion">Conclusion
- 📊 Although the market appears to be anticipating a price increase, it should be noted that the BTC price is still showing a sideways movement with weak volume. Market sentiment is still in wait-and-see mode.
- 🚩 If the war is prolonged, coupled with the effects of a Fed rate hike and a reduction in the balance sheet, structurally speaking, it will be difficult to see positive demand from market participants.
Other news from the crypto world in the last week
- 💵 Ukrainian government seeking donations in cryptocurrencies: Bitcoin and Ethereum wallets registered by the government on Twitter have received a total of crypto worth approximately $4.9 million. The Ethereum wallet has received over $3.9 million in donations as of February 25, 2022. The Bitcoin wallet has received $970,000 at the same time.
- 🎸 Warner Music and Splinterlands collaborate to create a play-to-earn game: US-based record label Warner Music Group and blockchain gaming company Splinterlands have agreed to develop a play-to-earn (P2E) blockchain game designed for mobile devices.
Reference
- Jeff Benson, Bitcoin Price Nosedives After Putin Declares War on Ukraine, Decrypt, accessed on 27 February 2022
- Kevin Reynolds, Ukrainian Government Receives $5M in Crypto Donations After Russian Invasion, Coin Desk, accessed on 27 February 2022
- Kate Irwin, Warner Music Group and Splinterlands Collaborating on Play-to-Earn Games, Decrypt, accessed on 27 February 2022
- Ashutosh Pandey, Gold, oil prices surge as Putin orders troops to Ukraine, DW, accessed on 27 February 2022
Share