Four Charts Suggest That the Bull Run Peak Hasn’t Happened Yet!
After reaching their all-time highs, Bitcoin and most altcoins have entered a downtrend phase. This has led to a pessimistic sentiment in the market, with some believing that the bull run has come to an end. However, several charts and technical indicators suggest otherwise. The bull run may still be in play!
Article Summary
- 👀 The recent decline in BTC and altcoins has led to some assumptions that the bull run might be over.
- 🔍 Some charts and graphs show that the recent downtrend is normal and has occurred in previous cycles.
- 💡 Based on previous cycles, BTC and altcoins have recovered and began their bull run peak after the correction and sideways movement.
- 🚀 In addition to charts, on-chain metrics indicators such as true hash rate and short-term holder (STH) realized price are also in the position before the peak of the bull run in the previous cycle.
A Growing Sense of Pessimism
The crypto market started 2024 with solid momentum, fueled by BTC’s resurgence from the $40,000 range to a new all-time high of $73,750 in March. Anticipation for the halving event and the launch of Bitcoin spot ETFs served as positive catalysts driving the price surge.
Unfortunately, the positive trend for BTC and other cryptocurrencies was short-lived. As of writing, BTC is trading in the $55,500 range, significantly declining from its previous consistent range of $60,000 to $70,000.
Given BTC’s correction, altcoins have fared even worse. After experiencing a strong rally since Q3-2023, many altcoins reached their all-time highs in Q1-2024. However, most altcoins have fallen 60-70% from their peaks.
This downtrend led to a sense of pessimism, with some believing that the bull run had ended. However, it’s important to note that sideways market movements with corrective tendencies are a natural occurrence following halving events. This pattern has also been observed in previous cycles.
You can read a guide to five trading tips when the market is sideways in the following article.
Before delving further, it’s crucial to remember that cycle ranges and structures cannot provide accurate future price predictions. Nevertheless, they offer key reference points and probabilities that can trigger or invalidate trading setups.
Bull Market Potential Chart
For those of you who are pessimistic, some of these charts might boost your confidence. Despite the current conditions, some well-known traders have shared their analysis and charts showing that the bull market is here to stay!
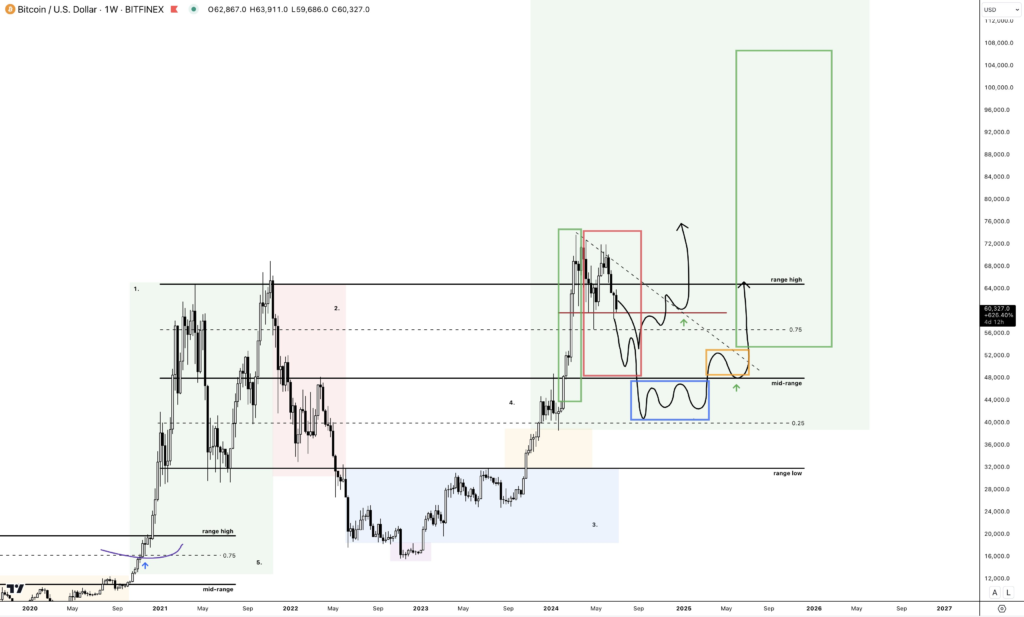
1. BTC’s Update with Hyblock Heatmaps
In his analysis, Marco Joanning states that the BTC chart is still closed within the $58,000-$72,500 range. BTC is still in bull territory, considering the Higher Time Frame (HTF).
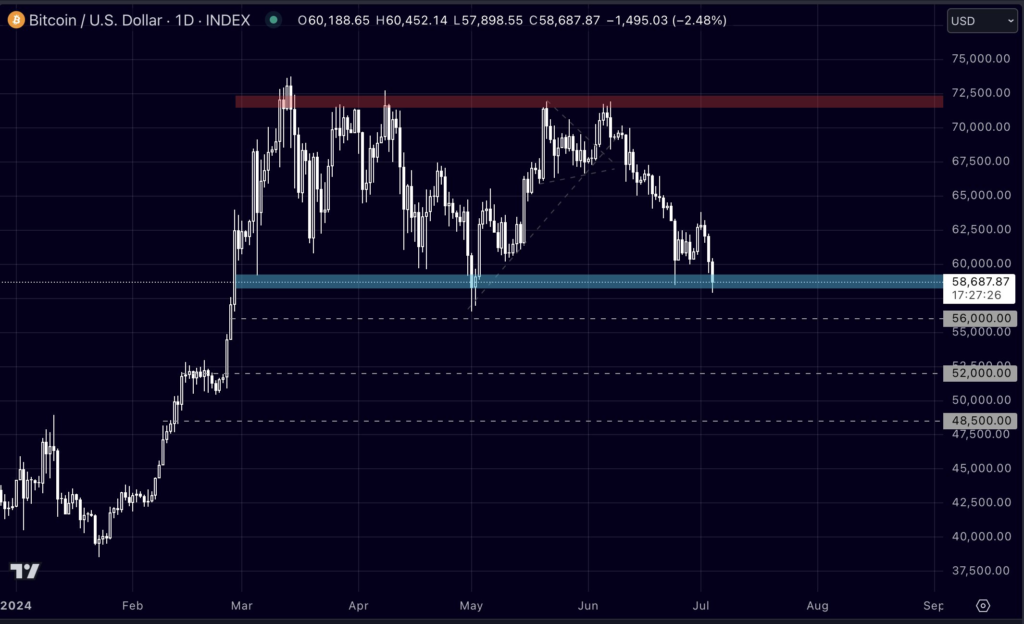
However, if BTC closes below the lower range in the future, the area marked with the dotted line will be the next focus. This point has the potential to be a trend-reversal area. He uses the hyblock liquidation level as one of the references for the reversal point along with the high liquidation level in that area.
The Liquidation Heatmap predicts the price level where large liquidations occur. As a chart, it can be interpreted to predict the potential trend of price movements as it can become a support or resistance point. Simply put, liquidation levels can put significant pressure on the buy or sell side of the order book, leading to a natural price reversal.
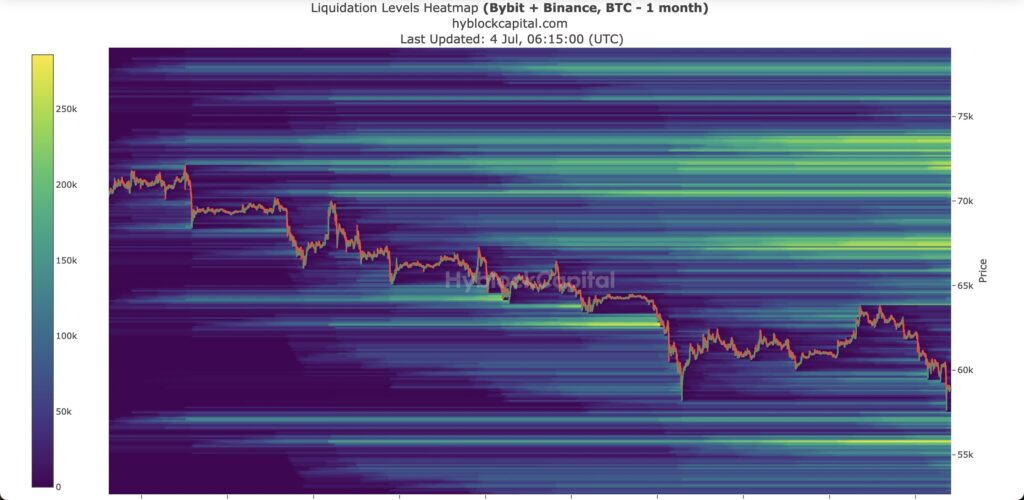
Furthermore, he expects a reversal when BTC closes below $58,000. However, the reversal may not occur until a few weeks, and the process will be slow and gradual. According to him, the market is currently in “patience” mode, so market participants should not be too hasty in making decisions.
2. Market Structure Update
Despite the recent correction trend, Damskotrades’ analysis shows that BTC is still maintaining its bullish trend in terms of market structure and cycles. The Lower Time Frame (LTF) has formed at the 0.75 level on a larger scale, which shows that BTC’s market structure is still intact.
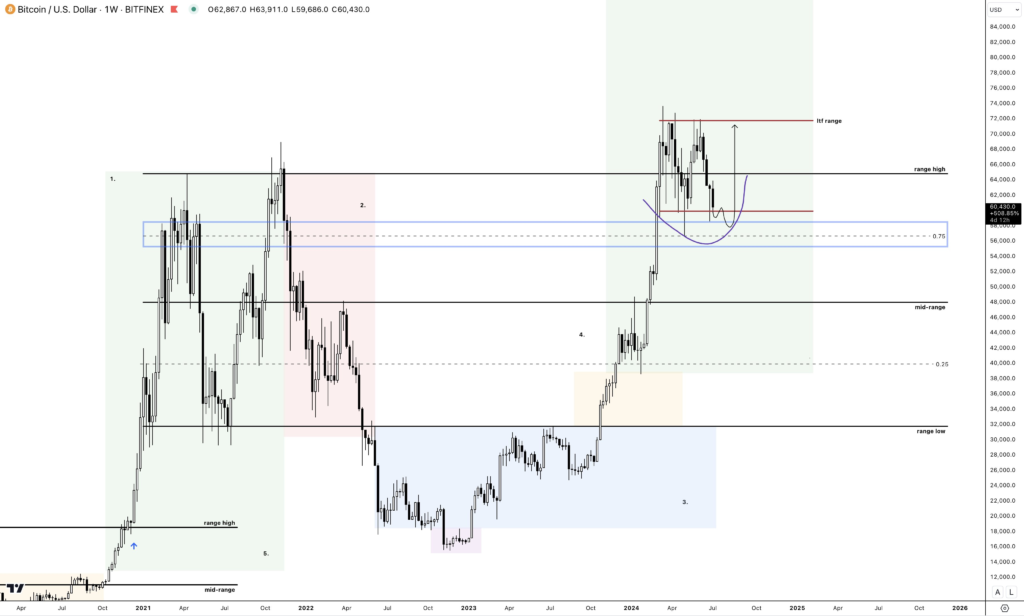
According to Damskotrades, the 0.75 level in the $55,000 area is a critical support level for BTC. Maintaining the 0.75 level is crucial to be able to record higher prices on the HTF.
On the one hand, testing the 0.75 level is a good sign. This is because BTC first fell to the 0.75 area in the previous bull run cycle before reversing course and continuing the bullish trend. It should be noted that in the last cycle, BTC has never fallen below the 0.75 level.
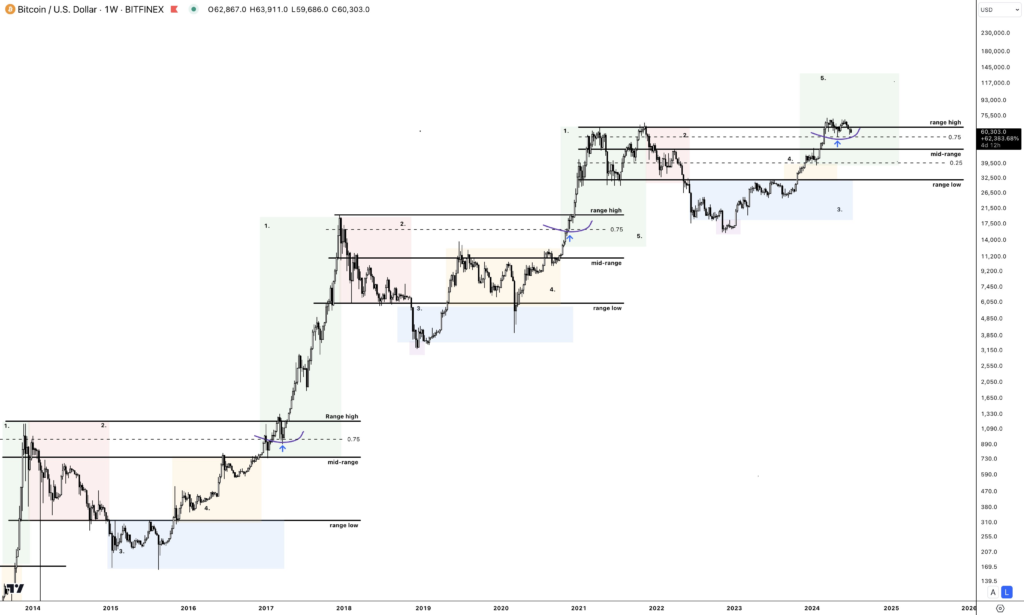
However, what if the pressure on BTC continues and causes its price to break through the 0.75 level? Damskotrades analyzes that there are two possibilities. First, the price will continue to fall, forming a new mini cycle in the 0.25 – midrange range. Second, after passing 0.75, the price of BTC will rebound and could head towards a bullish trend.
Using the Fibonacci indicator can provide more accurate buy or sell points. Learn how to use it here.
3. On-Chain Metrics Update
Another chart that suggests a bull run is still in the cards is the true hash rate drawdown % of the Bitcoin network. Not long ago, the true hash rate drawdown showed miners approaching the capitulation phase of selling their Bitcoin. A low hash rate indicates that fewer miners are securing the BTC network.
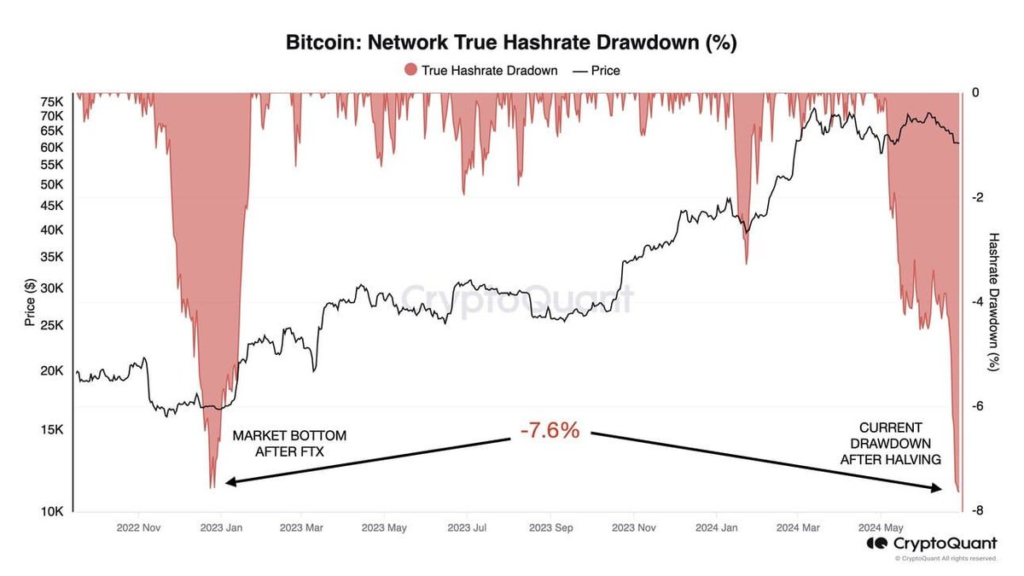
The optimism behind this chart is that BTC has been in an uptrend since the beginning of 2023, so a pullback will happen sooner or later. At the same time, the recent pullback reached the same point as the market bottom after the FTX crash. However, after reaching that bottom, BTC rebounded and started a rally until recently.
Further optimism for a bull run is also seen in the on-chain chart. The recent BTC correction brought its price below the short-term holder’s (STH) realized price, which was last seen in August 2023. However, by the end of October, the BTC price had managed to get back above the STH realized price. After that, BTC rallied to record an ATH.
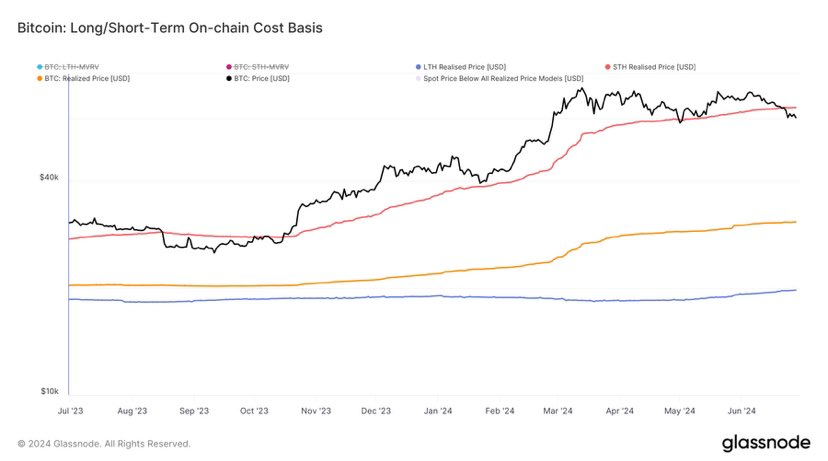
Given the patterns and trends, this correction may turn sideways in the next few months. Only then will the BTC price return above the STH realized price and start its rally.
STH realized price is a metric that represents the average purchase price of BTC from investors categorized as short-term BTC holders. An investor is considered a short-term holder when they have only held their BTC for less than 155 days.
Check out the explanation of on-chain analysis and how to use it in the following article.
4. Altseason Chart Update
Altseason seems out of reach amidst the recent altcoin bloodbath and the prevailing pessimism in the crypto market. However, Damskotrade’s chart below offers a glimmer of hope for its arrival.
The chart is based on the historical trend where the altcoin market cap follows the trend and pattern of Bitcoin’s price movements, albeit with a lag. Currently, the altcoin market cap exhibits a bullish range low reclaim setup on the HTF and a bullish market structure (higher highs and lows) on the HTF.
The long-term upside potential appears substantial. However, it’s crucial to acknowledge the equally significant risks involved. Moving towards the range low area could lead to months of sideways market movement and a 30% decline possibility.
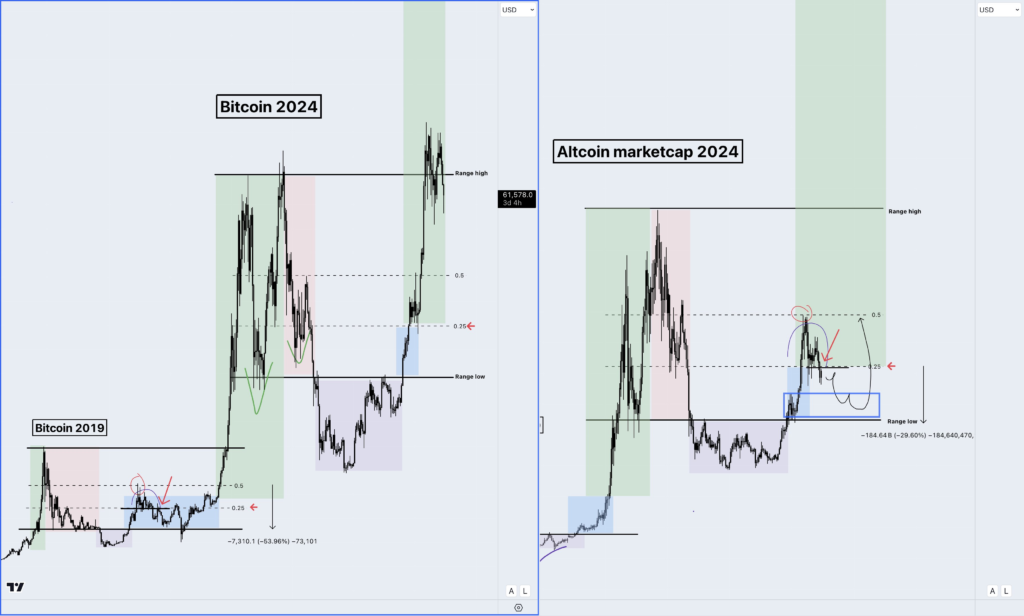
With the recently confirmed altcoin correction trend, it’s reasonable to assume that the altcoin market cap is moving away from the 0.25 deviation level. This implies a high likelihood of altcoin prices entering a sideways market. On the one hand, the altcoin market cap has the potential to retest the range low area indicated in the chart.
The good news, however, is that this pattern replicates what happened to Bitcoin in 2019. The chart above shows BTC confirming HTF, then breaking below the range low. Upon attempting a rebound, BTC was rejected by the resistance point in the midrange area (0.5) and subsequently retested the range low area.
Observing the altcoin market cap’s movements has mirrored Bitcoin’s actions in 2019. To confirm parabolic movement, the altcoin market cap must reclaim the 0.25 deviation level as its support point. If successful, it could trigger parabolic stage 5, also known as altseason.
If parabolic stage 5 unfolds, these five tips can help optimize your trading results during the bull run.
Conclusion
Pessimism has recently gripped the crypto market as the prices of BTC and altcoins have plummeted. This has led some to question whether a bull run will still be in the cards for the near future. However, several charts and indicators suggest that the possibility of a bull run is still very much alive.
Historically, the current market structure pattern resembles 2019, where the parabolic stage has not yet occurred in the current cycle. On-chain metric indicators such as true hash rate and short-term holder (STH) realized price to support this assumption. In other words, a bull run is still very possible in late 2024 or 2025.
It is important to reiterate that past cycle structures, trends, and prices do not reflect future prices. However, they can still be used as critical points and probabilities that trigger or cancel a trading setup.
Buy Crypto Assets on Pintu
Looking to invest in crypto assets? No worries, you can safely and conveniently purchase a wide range of cryptocurrencies such as BTC, ETH, SOL, and others safely and easily at Pintu. Pintu diligently evaluates all its crypto assets, highlighting the significance of being cautious.
Pintu is also compatible with popular wallets such as Metamask to facilitate your transactions. Download Pintu app on Play Store and App Store! Your security is guaranteed because Pintu is regulated and supervised by Bappebti and Kominfo.
Aside from buying and trading crypto assets, you can expand your knowledge about cryptocurrencies through various Pintu Academy articles. Updated weekly, all Pintu Academy articles are made for knowledge and educational purposes, not as financial advice.
References
- Marco Johanning, Bitcoin update & Hyblock Heatmaps, X, accessed on 4 July 2024.
- Crypto Amsterdams, Market Breakdown, X, accessed on 4 July 2024.
- Crypto Distilled, Was June A Bear Trap? X, accessed on 4 July 2024.
- Marty Party, BTC network true hash rate drawdown % approaches FTX level, X, accessed on 4 July 2024.
- James van Straten, BTC fell below the short term holder realized price in August 2023, X, accessed on 4 July 2024.
Share
Related Article

See Assets in This Article
BTC Price (24 Hours)
Market Capitalization
-
Global Volume (24 Hours)
-
Circulating Supply
-