How to Use Fibonacci in Crypto Trading
Both beginner and professional traders love the Fibonacci indicator. It’s easy and practical. In addition, Fibonacci also provides accurate signals when combined with other technical indicators. Traders most commonly use Fibonacci retracements and Fibonacci extensions. Want to know what these two Fibonacci indicators do and how to use them? Check out the full article below.
Article Summary
- 📊 There are two Fibonacci indicators that crypto traders often use: Fibonacci retracements and Fibonacci extensions. Both are displayed in ratios such as 0.236 or 23.6%, 0.618 or 61.8%, 1 or 100%, 1.618 or 161.8%, and 2.618 or 261.8%.
- 🔎 Fibonacci retracements can help identify areas of support and resistance in the movement of crypto assets.
- 👁️ Fibonacci extensions are often used to determine price target areas for taking profits.
- ⚠️ As a technical indicator, Fibonacci retracement or extensions cannot stand alone. The use of other technical indicators is required for more optimal results.
What is Fibonacci?
In financial markets, Fibonacci is a series of numbers generated by adding the last two. The Fibonacci series of numbers are 0, 1, 1, 2, 3, 5, 8, 13, 21, 34, 55, etc. This series of Fibonacci numbers is used to form Fibonacci retracements and extensions.
However, in Fibonacci retracements and extensions, the numbers are converted into ratios and displayed as percentages or decimals. For example, the numbers in Fibonacci retracement are 0.236 or 23.6%, 0.382 or 38.2%, 0.618 or 61.8%, 0.764 or 78.6%, up to 1 or 100%. Meanwhile, in Fibonacci extensions, the numbers are 1,000 or 100%, 1,618 or 161.8%, 2,618 or 261.8%, 3,618 or 361.8%, and 4,236 or 423.6%.
These ratios are often found in asset price movements because they are based on human psychology and herd behavior. This assumption is also reinforced by price movements that never form a straight line but form a zigzag pattern. For example, prices will not always rise in an uptrend because there will be several corrections along the way, and vice versa.
Therefore, these ratios can be used as a reference to predict where prices will move. Traders also utilize fibonacci retracements and extensions to determine potential support, resistance, or target price points for an asset. Ultimately, they are best combined with limit orders to maximize trade execution.
Pintu Academy has prepared an article on the use of limit orders in range trading and position trading strategies.
Two Types of Fibonacci Indicators
As mentioned in the previous section, there are two types of fibonacci indicators: fibonacci retracements and fibonacci extensions.
Fibonacci Retracement
Fibonacci retracement is a horizontal line on the price chart that can indicate areas of support or resistance that are likely to form. It shows how likely a previous trend is to retrace before continuing its trend again. In other words, it estimates pullbacks that occur in a price movement trend.
A pullback is a price movement that goes against the direction of the ongoing trend.
Using fibonacci retracement, traders can identify potential support and resistance levels during retracement in a trend. When a retracement occurs in an uptrend, the fibonacci level that appears can be used as a support area or entry point. Meanwhile, retracement in a downtrend will generate fibonacci levels that can be used as resistance areas or exit points.
Price levels on fibonacci retracement are obtained by applying fibonacci ratios such as 23.6%, 38.2%, 50%, 61.8%, and 78.6% to the previous price swing.
You can also learn how to determine support and resistance through this article.
Fibonacci Extensions
Fibonacci extensions are horizontal lines on price charts to indicate potential price levels where the trend will reach a price target or reverse. They are different from fibonacci retracements. This is because fibonacci extensions ignore price retracement. It focuses more on estimating how far the price will move after the pullback ends.
The assumption is that it is likely to continue when the price crosses a fibonacci extension level. In other words, fibonacci extensions show possible areas of interest.
Thus, traders often use fibonacci extensions to determine price targets for profit-taking. When using fibonacci extensions, traders already believe that the asset’s price will rise.
Price levels on fibonacci extensions are obtained by applying fibonacci ratios such as 61.8%, 100%, 127.2%, 161.8%, and 261.8% at the end of the previous retracement.
The Difference Between Fibonacci Retracament and Fibonacci Extensions
Here’s how fibonacci retracament and fibonacci extensions differ:
| Fibonacci Retracement | Fibonacci Extensions |
|---|---|
| 2-click drawing tool | 3-click drawing tool |
| Measures pullbacks within an uptrend and bounces within a downtrend | Measures how far an uptrend or downtrend will extend |
| Identify support and resistance levels | Determine the target price to take profit |
| Frequently used fibonacci ratios: 23.6%, 38.2%, 61.8%, and 78.6% | Frequently used fibonacci ratios: 61.8%, 100%, 161.8%, and 261.8% |
How to Use Fibonacci
In terms of timeframe, fibonacci is a flexible indicator. That is, it can be used for short or long periods, according to the needs and goals of each trader.
Before using Fibonacci to identify support or resistance levels, traders must be able to identify “swing highs” and “swing lows.” Knowing and identifying them is essential because they are the most critical elements in drawing Fibonacci lines.
A swing high is the highest point of a candlestick on a price trend surrounded by lower highs on its left and right. Conversely, a swing low is the lowest point of a candlestick surrounded by higher lows on both sides.
Confused about the meaning behind a candlestick pattern? Relax, the following article can help you read candlesticks easily.
1. Identifying and Capitalizing on Trends
Price movements generally have patterns and will repeat, and fibonacci is no exception. By understanding these patterns, traders can see the direction and take advantage of the trend. The following are three patterns on fibonacci retracement that can be used to read price movement trends.
- Pullback on Uptrend
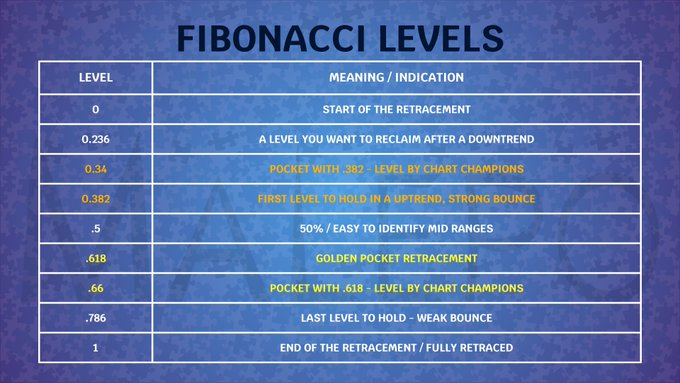
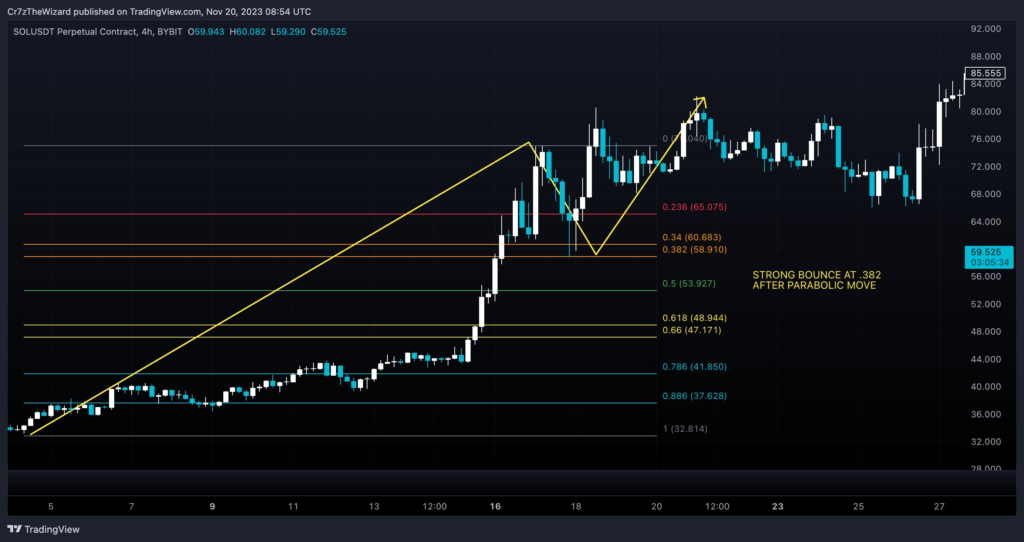
In a strong uptrend followed by a retracement to the 0.382 area, there is a high probability that the price will bounce hard. If an asset has a similar movement pattern, then the 0.382 area could be an ideal entry point.
- Golden Pocket
The golden pocket is the space between the fibonacci 0.618 and 0.66 levels. It’s a great area to enter into your entries. If the price experiences a pullback and enters the golden pocket area, the price will likely reverse into an uptrend.

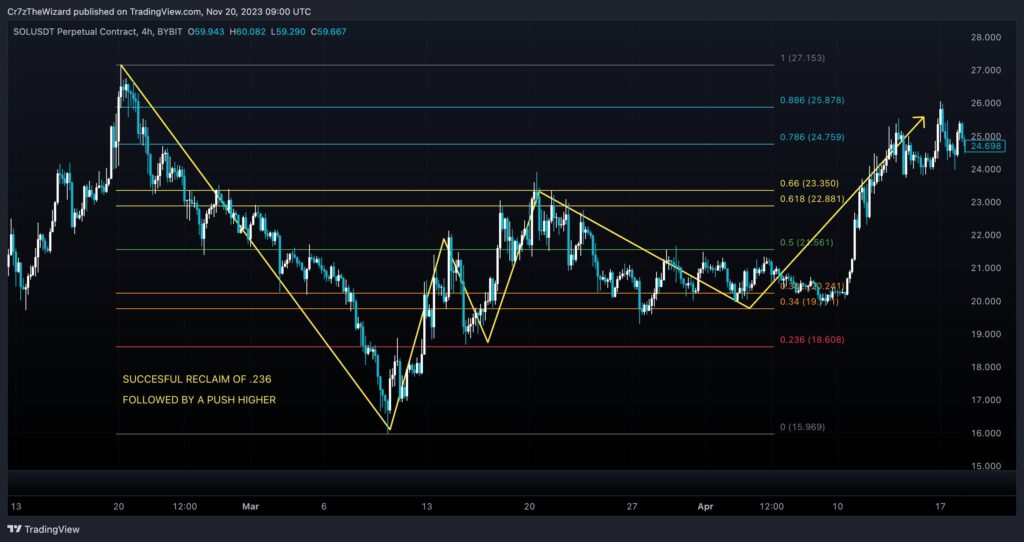
- Retracement on Downtrend
If an asset price gets rejected at .236 after a strong downward move, that asset is likely going for new lows. Ensure the 0.236 level turns into a support level, and the golden pocket area becomes resistance if you want to open a position. After crossing it, every time the price goes into a downtrend, it can be an opportunity to go short.
2. Finding Support Level
After locating the swing low and swing high points, connect them using the retracement tool available on TradingView. Make sure to draw the line from bottom to top, not vice versa. TradingView will automatically display support levels using fibonacci ratios or retracements.
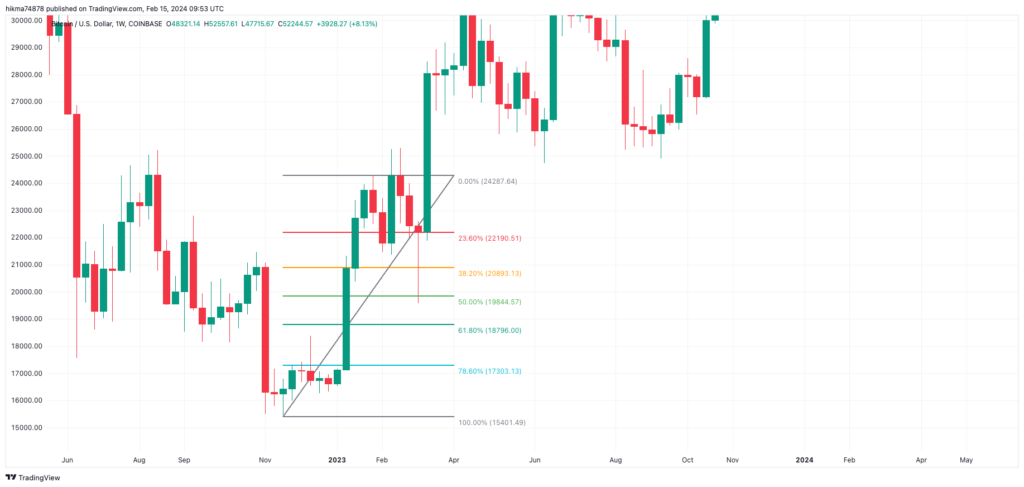
The chart above shows that the 23.60%, 38.20%, 50%, 61.8%, and 78.60% retracements can be used as support levels for BTC in that period. After reaching its lowest point at $15,422, BTC went on an uptrend until it reached $24,262.
The price movement above shows that the retracement that occurred in the price of BTC was not too deep. BTC experienced several corrections by breaking the first support at 23.60%, the second support at 38.20%, and the third support at 50%. However, after the retracement, BTC resumed its uptrend movement.
If a trader wants to buy BTC, the fibonacci retracement points that show the support area can be used as a buying area. Remember that Fibonacci cannot be used as a single technical indicator. Combine it with other technical indicators for more optimal results.
3. Finding Resistance Level
Using fibonacci retracement to find potential resistance points is similar to the previous method. It’s just that traders must connect the swing high to the swing low. After that, each fibonacci ratio will be seen, which can be used as a resistance area.

For example, the chart above shows the resistance area on the ETH/USD chart. The area is derived from connecting the swing high at 2,024 to the swing low at 1,078.
As a result, it can be seen that the 23.60%, 61.80%, 78.60%, and 100% retracement levels acted as resistance areas on several occasions. This makes it an optimal take-profit area for traders. To get more accurate points, combine fibonacci retracement with other technical indicators.
The asset's price movement trend or volatility will significantly affect the entry or exit points. If the retracement is deep enough, the fibonacci levels used as support/resistance are 50%, 61.80%, and 78.60%. Meanwhile, if the retracement is not too deep, the fibonacci levels used as support/resistance are 23.60%, 38.20%, and 50%.
4. Finding Price Target
If fibonacci retracement is used to determine support and resistance points, fibonacci extensions determine price targets. With fibonacci extensions, traders must connect three points instead of just two.
On the TradingView toolbar, select Trend-Based Fibonacci Extensions. Then, connect the first point (swing low) to the second point (swing high). Basically, fibonacci extensions measure the length of the trend between the first and second points.
After that, connect it to the third point, the swing low that occurs after the second point. This point should be higher than the swing low used in the first point. The third point is the retracement that happened in the previous rally. The fibonacci level lines will appear automatically when all three points are connected.

In the BTC/USD chart above, the first point is $19,600 (swing low), the second point is $30,950 (swing high), and the third point is 24,735 (second swing low). By connecting the three, the respective fibonacci ratio levels can be seen. It can be seen that the price of BTC was stalled and hesitant near several of the Fibonacci levels at the 61.80%, 100%, 111.3%, and 161.8% levels. These four levels can be used as price targets for BTC owners.
When this article was written, BTC was experiencing a rally and moving towards the 261.80% level, which is $54,506. This can prove that fibonacci extensions can be one of the indicators to determine price targets.
Keep in mind that Fibonacci ratio levels are not absolute. The asset's price may pass through it first or only get close to it before finally experiencing a pullback.
Conclusion
As technical indicators, fibonacci retracements and extensions can make it easier for traders to find support or resistance area and price targets. However, like any other technical indicator, they won’t always be accurate. In addition, the Fibonacci indicator cannot stand alone as an analytical tool. Other technical indicators, such as moving averages and stochastics, are still needed to get more optimal analysis results.
Buy Crypto Assets on Pintu
After knowing how to use fibonacci, don’t forget to use them before buying crypto assets on Pintu. You can safely and conveniently purchase many cryptocurrencies such as BTC, ETH, SOL, and others safely and easily at Pintu. Pintu diligently evaluates all its crypto assets, highlighting the significance of being cautious.
Pintu is also compatible with popular wallets such as Metamask to facilitate transactions. Download the Pintu app on the Play Store and App Store! Your security is guaranteed because Pintu is regulated and supervised by Bappebti and Kominfo.
Aside from buying and trading crypto assets, you can expand your knowledge about cryptocurrencies through various Pintu Academy articles. All Pintu Academy articles are updated weekly for knowledge and educational purposes, not as financial advice.
Share